My first moped had no fuel gauge, but a brilliant petrol tap. In the following picture, you can see the hose that protrudes a few centimeters into the tank. In the switch position on/on, the gasoline is removed from this hose until the air is also sucked. The engine begins to stutter, and the driver knows that he now has to switch the petrol tap on a reserve. Now he receives the remaining tank content and can still drive around 50 km.

You have the same effect with an LED that shows if you only have a small residual amount, the reserve, in the tank. Modern cars with multimedia displays also have this warning lamp, often accompanied by a short beep when the lamp is concerned.
LED
We want to use our little Micro Controllers for the other ads, which open up a variety of options. Let's start with several LEDs that show us the approximate content. With eight or ten colored LEDs, e.g. Greens for full or almost full, yellow for the medium area, and red for the reserve. The traffic light system is understood all over the world. You can take individual LEDs, but there are also small components with ten built-in LEDs, so-called bar graphs, monochrome, or with the color sequence just mentioned.

You can see from the many legs that every single segment is controlled separately, i.e. 8 or 10 or more outputs on the Micro Controller. That doesn't have to be, after all, there are integrated circuits with sliders such as the IC SN74HC595N, which I in the Blog "How our computer ticks" had introduced. I take the circuit out of the blog, exchanged two yellow LEDs each against red or green LEDs, and start programming.

/*
 Analogread displayed on 8 LEDs with Sn74HC595N
 Reads to analog input on pin 0, prints the results to the serial monitor
 and turn on one of 8 LEDs
 Attach the Center Pin of a 10 Kohm potentiometer to pin a0, and the outside pins to +5V and ground.
*/

// Arduino-Pin Connected to SHCP of 74HC595
intimately shiftpine = 8;
// Arduino-Pin Connected to STCP of 74HC595
intimately storepin = 9;
// Arduino-pin connected to ds of 74hc595
intimately datapine = 10;
// Array with Led Values
intimately indicator[8] = {0,0,0,0,0,0,0,0};
// counter
intimately I=0;


// The Setup Routine Runs Once When You Press Reset:
void set up() {
  // Initialize serial communication at 9600 Bits via second:
  Serial.Begin(9600);
  // define pins 8.9.10 AS outputs
  pin mode(storepin, OUTPUT);
  pin mode(shiftpine, OUTPUT);
  pin mode(datapine, OUTPUT);
}

// The Loop Routine Runs Over and Over Again Forever:
void loop() {
  // Read the input on analog pin 0:
  intimately sensorvalue = analogead(A0);
  // Print out the value you read:
  Serial.print("sensorvalue =");
  Serial.print(sensorvalue);
  intimately Xvalue = map(sensorvalue,0,1024,0,8);
  Serial.print("Xvalue =");
  Serial.print(Xvalue);
  for (I = 0; I<8; I++)   {
    indicator[I] = 0;
    }
  for (I = 0; I<=Xvalue; I++)   {
    indicator[I] = 1;
    }
  Serial.print("Indicator =");
  for (I = 0; I<8; I++)   {
  Serial.print(indicator[I]);
    }
  Serial.print();

  // Storepin to low
  digital(storepin, Low);

  for (I=0; I<8; I++) {
  // Start with all 3 pins low
  // Data Transfer (1 bit) at the change from low to high (positive-edge triggered)
  digital(shiftpine, Low);
  // Write value of the respective bit to ds pin
  digital(datapine, indicator[I]);
  // Shiftpin SHCP from Low to High for Data Transfer to the Sift Register
  digital(shiftpine, HIGH);
  }

  // When all 8 to are in Shift Register Put the Storepin STCP
  // from low to high, in order to copy all 18 bits
  // From the Shift Register to the Storage Register for Output

  digital(storepin, HIGH);

  delay(1000);        // Delay in between Reads for Stability
}
As an example, I close a 10 kohm potentiometer to A0 to simulate the fuel gauge. The SN74HC595N is connected to pins 8, 9, and 10.
The analog entrance provides (theoretically) values between 0 and 1023. With the one used in this experimental order Nano For the first time, I experience that the highest values are just over 900. Without further ado, I also connect the AREF entrance (the reference voltage for the analog-digital converter) to the power rail and get values up to 1020.
With the map () function, I would like to scale the measured values to values from 0 to 7.
First try: intimately Xvalue = map(sensorvalue,0,1023,0,7);
I don't get 7 displayed, even if I open the potentiometer against VCC, i.e. the seventh LED (tank full) would not light up.
Second try: intimately Xvalue = map(sensorvalue,0,1024,0,8);
I increase the upper values of the map ()-function by 1 and get exactly the subdivision I want to get.
With the Array Indicator [8] I head for the eight LEDs. After all the places are first set to 0, I set all values in the next counting loop to the index of the XVALUE value that has just been determined at 1.
For fun, I expanded the code so that the last red LED (tank almost empty) flashes briefly to attract attention. To do this, I connect the cathode of the LED to an output spin. If I put it on high briefly, the LED runs out briefly. This is one Download of the extended program.
LCD
Enough with LED experiments, now I want to use a robust LCD as a fuel gauge. With the LCD1602 you could even realize two fuel ads in the two lines with 16 characters. I choose the digital display of the value in the upper line and the "analog" display in the lower one.
First, build the circuit. It starts with deciding whether to connect the LCD1602 to many pins or use the LCD1602 with an I2C adapter.
I show both types in this blog, for myself it was a refresher of the spilled knowledge. In order to control the displays in a user-friendly manner, I first install the program libraries (libraries) under the pulldown menu of manage tools/libraries ... I enter "Liquid" in the search window and get several options.

The first library LiquidCrystal is displayed in the current Arduino IDE as a built-in and "installed". Unfortunately, I have not found any examples for this, so I also install the Adafruit Liquidcrystal library which supplies several sketch examples.

By scrolling down the roller beam in the bli library manager, I also find the library Liquidcrystal I2C, which I am installing right away.
But first I tinker with the LCD without the i2C adapter. The cabling is somewhat more complex because you need a potentiometer for the contrast of the display and six data pins on the microcontroller for data transmission.

From the original example "Hello World" I take over the lines with the PIN assignment. I connect another potentiometer for the simulation of the fuel gauge to the analog input A0.

/* Example sketch level indicator with lcd1602 * Liquidcrystal Library * The Circuit: * LCD RS Pin to Digital PIN 12 * Lcd enable pin to digital pin 11 * LCD D4 Pin to Digital Pin 5 * LCD D5 PIN to Digital PIN 4 * Lcd d6 pin to digital pin 3 * LCD D7 pin to digital pin 2 * LCD R/W pin to ground * 10K potentiometer (variable resistor): * ends to +5V and ground * wiper to LCD VO pin (pin 3) for contrast adjustment * VDD and A (Anode of backlight) to 5V * VSS, RW and K (Kathode of backlight) to GND */ // include the library code: #include <LiquidCrystal.h> // alternatively: //#include// initialize the library with the numbers of the interface pins LiquidCrystal lcd(12, 11, 5, 4, 3, 2); //(RS, EN, D4, D5, D6, D7) // alternatively: //Adafruit_LiquidCrystal lcd(12, 11, 5, 4, 3, 2); //(RS, EN, D4, D5, D6, D7) void setup() { // initialize serial communication at 9600 bits per second: Serial.begin(9600); // set up the LCD's number of columns and rows: lcd.begin(16, 2); // Print a message to the LCD. lcd.setCursor(0, 0); // (column, line) 0...15, 0...1 lcd.print("Hello, World!"); delay(1000); lcd.setCursor(0, 0); // (column, line) 0...15, 0...1 lcd.print(" "); } void loop() { // read the input on analog pin 0: int sensorValue = analogRead(A0); // print out the value you read: Serial.print("level indicator = "); int levelpercent=map(sensorValue,0,1024,0,101); Serial.print(levelpercent); int xValue = map(sensorValue,0,1024,0,16); String XXX = ""; for (int i=0; i<xValue+1; i++) { XXX = XXX + "X"; } for (int i=xValue+1; i<16; i++) { XXX = XXX + " "; } Serial.print(" xValue = "); Serial.print(xValue); Serial.println(XXX); // set the cursor to column 0, line 1 // (note: line 1 is the second row, since counting begins with 0): lcd.setCursor(0, 0); // print the number of seconds since reset: lcd.print("level = "); lcd.print(levelpercent); lcd.print(" % "); lcd.setCursor(0, 1); lcd.print(XXX); if (xValue==0) { // Turn on the blinking effect: lcd.noDisplay(); delay(300); // Turn off the blinking effect: lcd.display(); delay(1000); } delay(1000); }
I use the map function twice this time, once to convert the value of the AD converter into percent and display it in the top line, a second time to write X to the sixteen digits of the bottom line of the display corresponding to the tank filling. Again, I want to attract attention when the fuel is running low. With the method noDisplay / display I switch the display briefly off and on again to realize my intention by this effect.
The setCursor method is used to select the starting point of the character output. The first argument specifies the position in the line, the second the line. As so often, counting starts at 0; the value range is thus between 0 and 15 or 0 and 1 for the LCD1602, and between 0 and 19 or 0 and 3 for the LCD2004 accordingly.
Now to the LCD1602 with I2C adapter. The circuit is much simpler - only four cable connections to the microcontroller: VCC=5V, GND, SDA to A4, and SCL to A5. The potentiometer for the contrast is implemented on the I2C adapter. For visibility reasons, I connected the adapter to the LCD1602 via a mini breadboard. Normally this is soldered directly to the display as a "backpack".
The sketch is also adapted very quickly: First, the other library is included
// include the library code:
#include <LiquidCrystal_I2C.h>
Bei der Initialisierung wird die I2C-Adresse und die Display-Größe angegeben:
// initialize the library with the I2C-address and display details
// set the LCD address to 0x27 for a 16 chars and 2 line display (alternatively 20,4)
LiquidCrystal_I2C lcd(0x27,16,2);
Und in der Funktion void setup() werden folgende Befehle ergänzt:
// set up the LCD's number of columns and rows:
lcd.init();
lcd.backlight();
Hier der gesamte Sketch zum Download sowie ein Bild des Versuchsaufbaus:

OLED
Finally, I would like to realize a fuel gauge that looks deceptively similar to a pointer instrument. For this, I need a mini-oled, e.g. that 1.3 “I2C-OLED display. I hadn't used that for a long time and had to gradually approach myself. So quickly the eBook from the product page AZ-Delivery Download and look up which library I have to install. In the library, the administrator Enters U8G2, but this library is for many different displays. So in addition to including one of the many lines that apply to our display, one of the many lines must be arranged in the example sketch:
U8g2_sh1106_128x64_noname_1_hw_i2c U8G2(U8G2_R0, /* reset =*/ U8x8_pin_none);
If, for example, the graphic test works from the example sketches, all other lines that have been commented on can also be deleted.
The U8G2 program library by Olikraus is very powerful. It is not only used for very different displays but also offers a variety of graphic functions.
The following two links provide an overview:
https://github.com/olikraus/u8g2
https://github.com/olikraus/u8g2/wiki/u8g2reference
You can download the entire package as a ZIP file via the first link, but the library is established so far that it can be easily installed with the library manager. A lot of sample programs are also installed.


For my “fuel gauge” project, I only need a semicircle to simulate a pointer instrument and a straight line for the pointer. I will find it quickly under the second link with the reference. I need:
drawcircle and drawline
The pictures also get what the coordinate system for the display, in my case 128 by 64 pixels, looks. The count begins in the upper, left corner; From there you count from 0 to 127 to the right in the X direction and from 0 to 63 downwards in the Y direction.
The center of my semicircle and the starting point of the pointer is in the middle of the middle, i.e. at x = 63 and y = 63. The semicircle is quickly drawn with
U8G2.drawcircle( 63, 63, 63, U8g2_draw_upper_right|U8g2_draw_upper_Left);
The arguments are x = 63, y = 63, radius = 63, and then with | Links the desired quarter circles (Upper Right | Upper Left).
The function drawline Has four arguments, the X and Y coordinate of our pointer's start and finish points 60-pixel. We wanted to put the starting point on (63.63), done. But the target of my 60-pixel long line depends on the "tank content", ie a variable size so I have to calculate the values. It took me longer than expected, but I remembered wisdom from my naval youth: if the sailor no longer knows what to do, he makes a painting. Let's go:

The coordinates of the target point are: ZX = 63 + DX and ZY = 63 - DY
Dx = r * cos α and dy = r * sin α are
Where do I get the angle α from, which must also be specified for the angle functions in the arch? One step after the other: the angle 0 ° corresponds to 100% filling, 90 ° corresponds to 50% and 180 ° corresponds to 0% (empty). In the sketch, I use the variable P for the percentage filling. The angle is calculated with α = (100 - p) * 1.8.
Short plausibility sample: For p = 100 is α = 0 °, for p = 50 is α = 50*1.8 = 90 ° and for p = 0 is α = 180 °. And the sinus function and thus the value dy is positive from 0 ° to 180 °, and the cosine function and thus the value DX is negative between 90 ° and 180 °.
Now quickly converting from degree size: the full circuit has 360 ° to a degree; This corresponds to an arch size (circumference of the unit circuit) of 2*π (number Pi = 3.14 ...). Each angle α is converted with *2 *π / 360 or shortened *π / 180. And if we are already shortening: 1.8 and 180 can also be simplified. So the two formulas are:
dx = intimately(60*cos(3.14*(100-P)/100));
dy = intimately(60*sin(3.14*(100-P)/100));
Hier zunächst das Bild der Versuchsanordnung:

sowie der Sketch im Ganzen (download):
/* Example for a simple gauge with semicircle and pointer on 1.3" I2C OLED
based on OliKraus library U8g2
https://github.com/olikraus/u8g2
https://github.com/olikraus/u8g2/wiki/u8g2reference
by Bernd54Albrecht for AZ-Delivery
*/

#include <Arduino.h>
#include <U8g2lib.h>

#ifdef U8X8_HAVE_HW_SPI
#include <SPI.h>
#endif
#ifdef U8X8_HAVE_HW_I2C
#include <Wire.h>
#endif

// Initialize the 1.3” I2C OLED
// The complete list of displays is available here: https://github.com/olikraus/u8g2/wiki/u8g2setupcpp
U8G2_SH1106_128X64_NONAME_1_HW_I2C u8g2(U8G2_R0, /* reset=*/ U8X8_PIN_NONE);

int p,dx,dy,sensorValue;

void setup(void) {
  // initialize serial communication at 9600 bits per second:
  Serial.begin(9600);
  u8g2.begin();
}

void loop(void) {
  // read the input on analog pin 0:
  sensorValue = analogRead(A0);
  p = map(sensorValue,0,1024,0,101);
  Serial.print(p);
  u8g2.firstPage();
  do {
// example for text
//    u8g2.setFont(u8g2_font_ncenB14_tr);
//    u8g2.drawStr(0,15,"Hello World!");
    u8g2.drawCircle( 63, 63, 63, U8G2_DRAW_UPPER_RIGHT|U8G2_DRAW_UPPER_LEFT);
    dx = int(60*cos(3.14*(100-p)/100));
    Serial.print("  dx = ");
    Serial.print(dx);
    dy = int(60*sin(3.14*(100-p)/100));
    Serial.print("  dy = ");
    Serial.println(dy);
    u8g2.drawLine(63, 63, 63+dx, 63-dy);
  } while ( u8g2.nextPage() );
  delay(1000);
}
So much for my introduction to the exemplary display of a filling quantity. Finally, I would like to give you an overview of the displays that come into question for small projects:
|
Bezeichnung |
Techn. |
Bus |
Sp. |
Zl. |
Diag. |
Pix. X |
Pix. Y |
Height |
Graphic |
|
2x16 LCD blaues Display |
LCD |
Parallel |
16 |
2 |
5,55 |
No |
|||
|
2x16 LCD grünes Display |
LCD |
Parallel |
16 |
2 |
5,55 |
No |
|||
|
2x16 LCD blaues Display I2C Bundle |
LCD |
I2C |
16 |
2 |
5,55 |
No |
|||
|
2x16 LCD grünes Display I2C Bundle |
LCD |
I2C |
16 |
2 |
5,55 |
No |
|||
|
4x20 LCD blaues Display |
LCD |
Parallel |
20 |
4 |
4,75 |
No |
|||
|
4x20 LCD grünes Display |
LCD |
Parallel |
20 |
4 |
4,75 |
No |
|||
|
4x20 LCD blaues Display I2C Bundle |
LCD |
I2C |
20 |
4 |
4,75 |
No |
|||
|
4x20 LCD grünes Display I2C Bundle |
LCD |
I2C |
20 |
4 |
4,75 |
No |
|||
|
LCD Display 2x16 with Keypad Shield |
LCD |
I2C |
16 |
2 |
5,55 |
No |
|||
|
LCD Display 84x48 Pixel |
LCD |
SPI |
14 |
6 |
1,7 |
84 |
48 |
4,34 |
Yes |
|
128x64 LCD blaues Display |
LCD |
Parallel/SPI |
21 |
8 |
3,1 |
128 |
64 |
5,68 |
Yes |
|
0,91 Zoll I2C OLED Display |
OLED |
I2C |
21 |
4 |
0,91 |
128 |
32 |
2,58 |
Yes |
|
0,96 Zoll I2C OLED Display |
OLED |
I2C |
21 |
8 |
0,96 |
128 |
64 |
1,76 |
Yes |
|
1,3 Zoll I2C OLED Display |
OLED |
I2C |
21 |
8 |
1,3 |
128 |
64 |
2,38 |
Yes |
|
0,66 Zoll OLED Display Shield |
OLED |
I2C |
10 |
6 |
0,66 |
64 |
48 |
1,83 |
Yes |
|
1,77 Zoll SPI TFT Farbdisplay |
TFT |
SPI |
21 |
20 |
1,77 |
128 |
160 |
1,68 |
Yes |
|
1,8 Zoll SPI TFT Farbdisplay |
TFT |
SPI |
21 |
20 |
1,8 |
128 |
160 |
1,70 |
Yes |


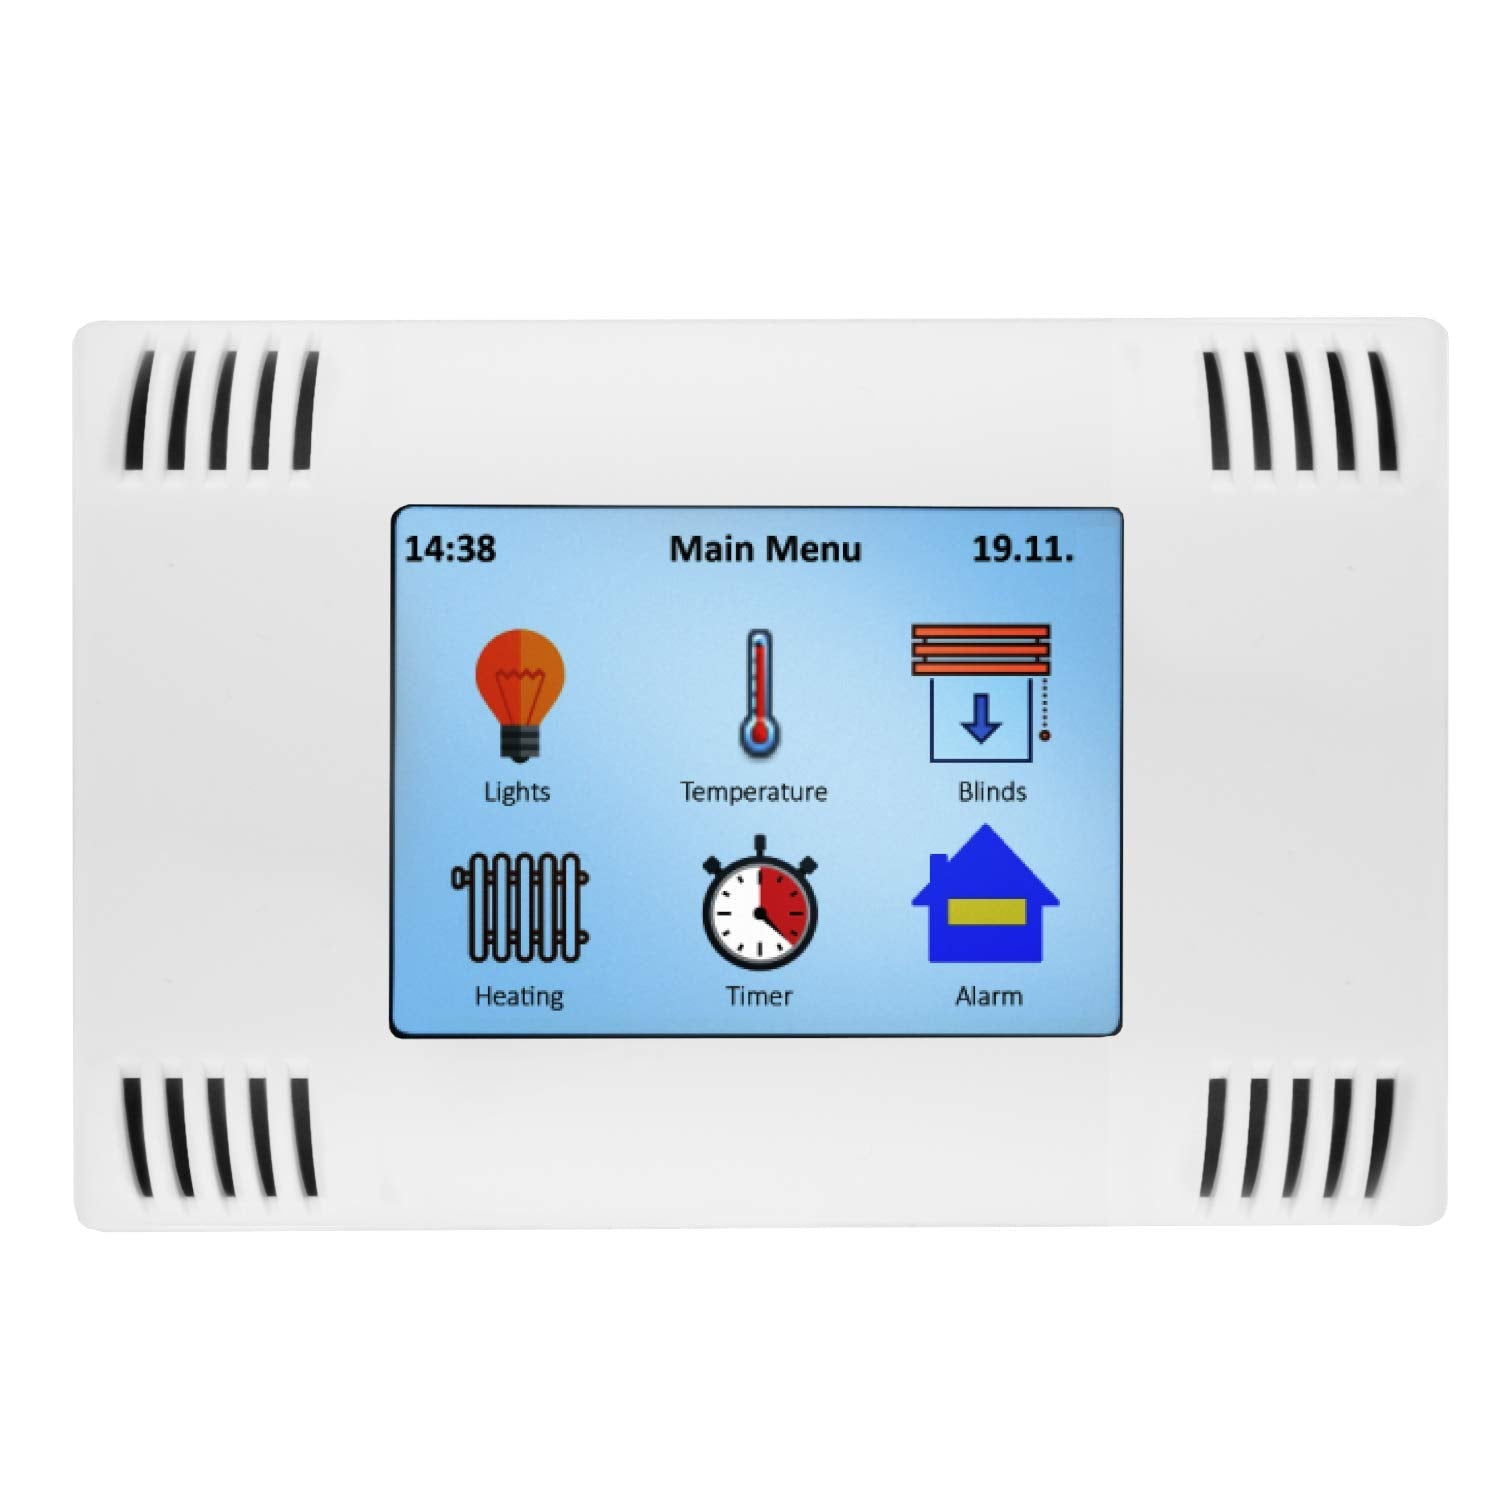
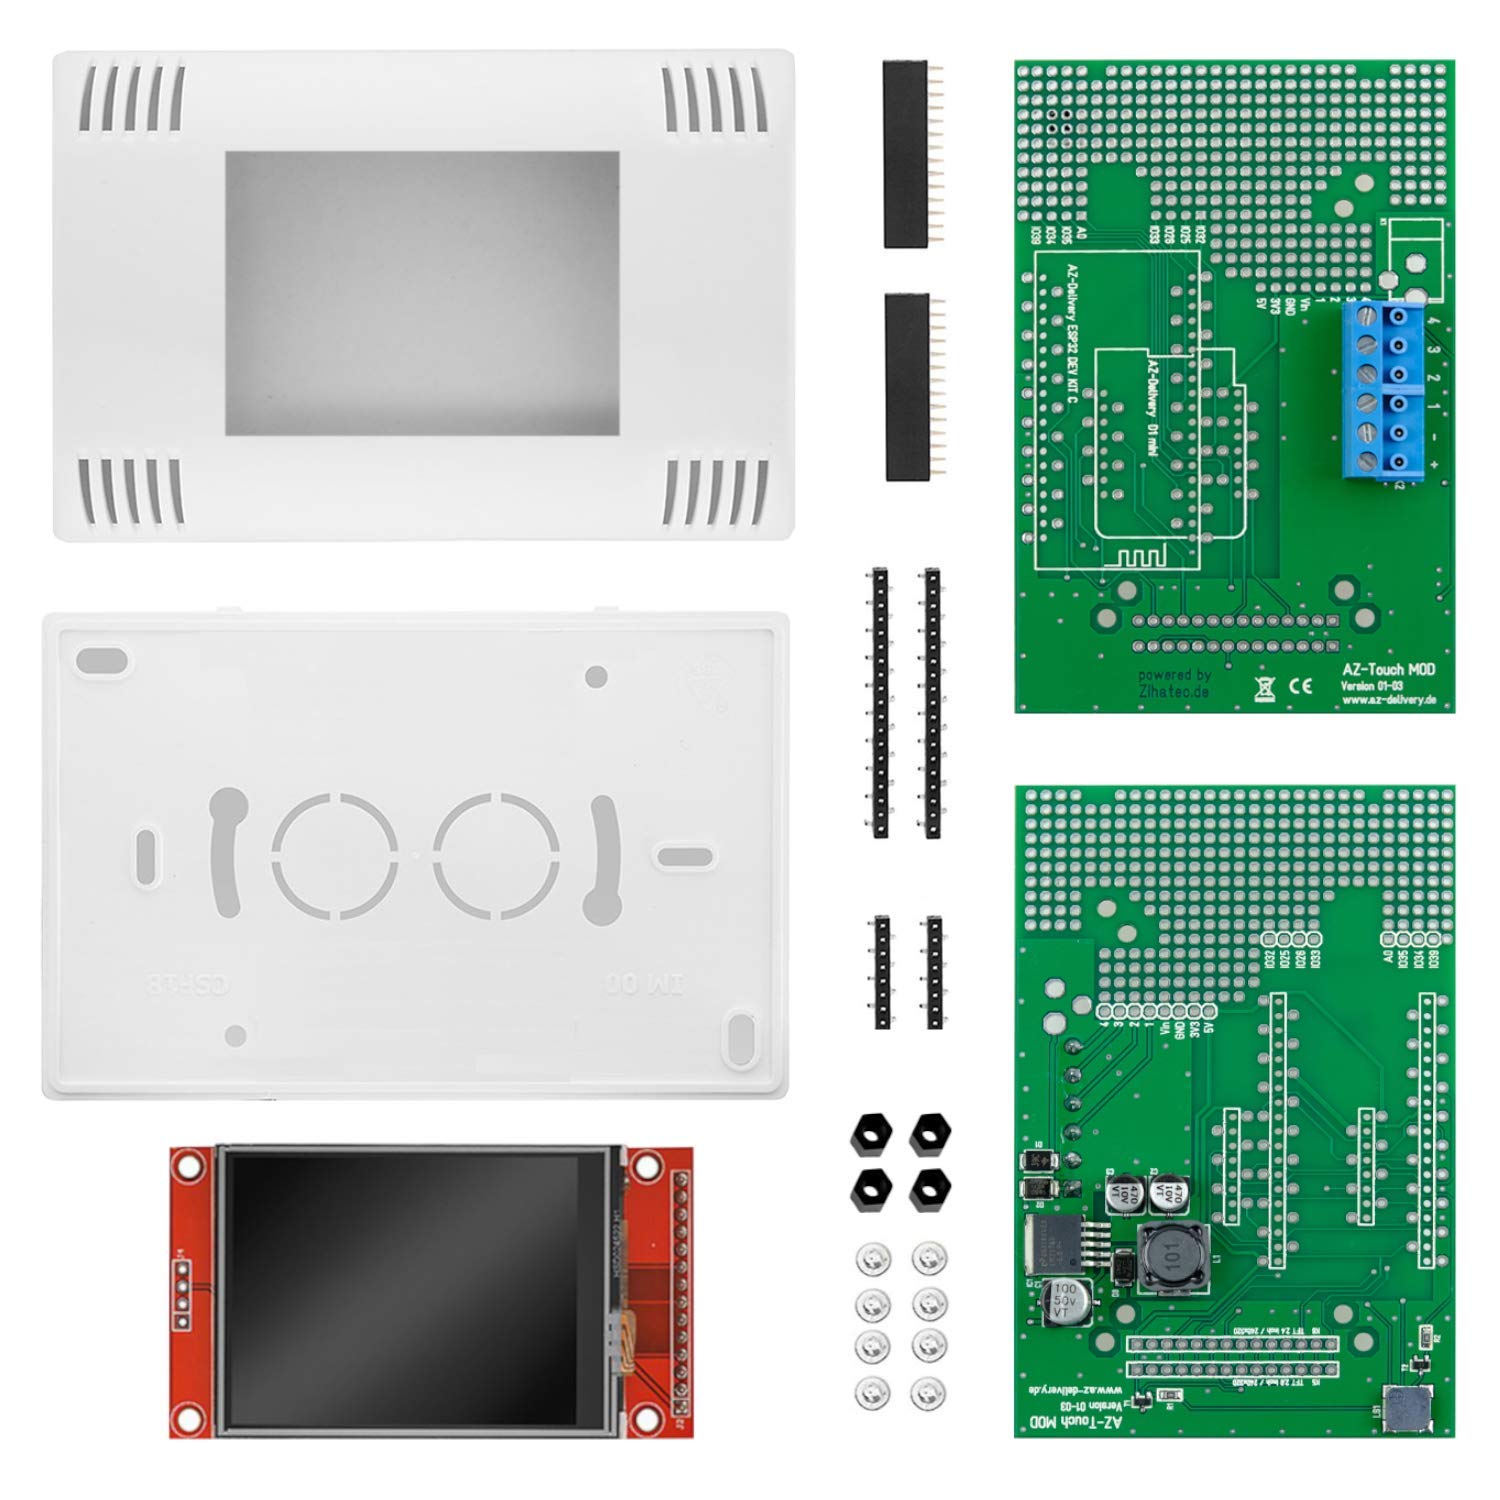
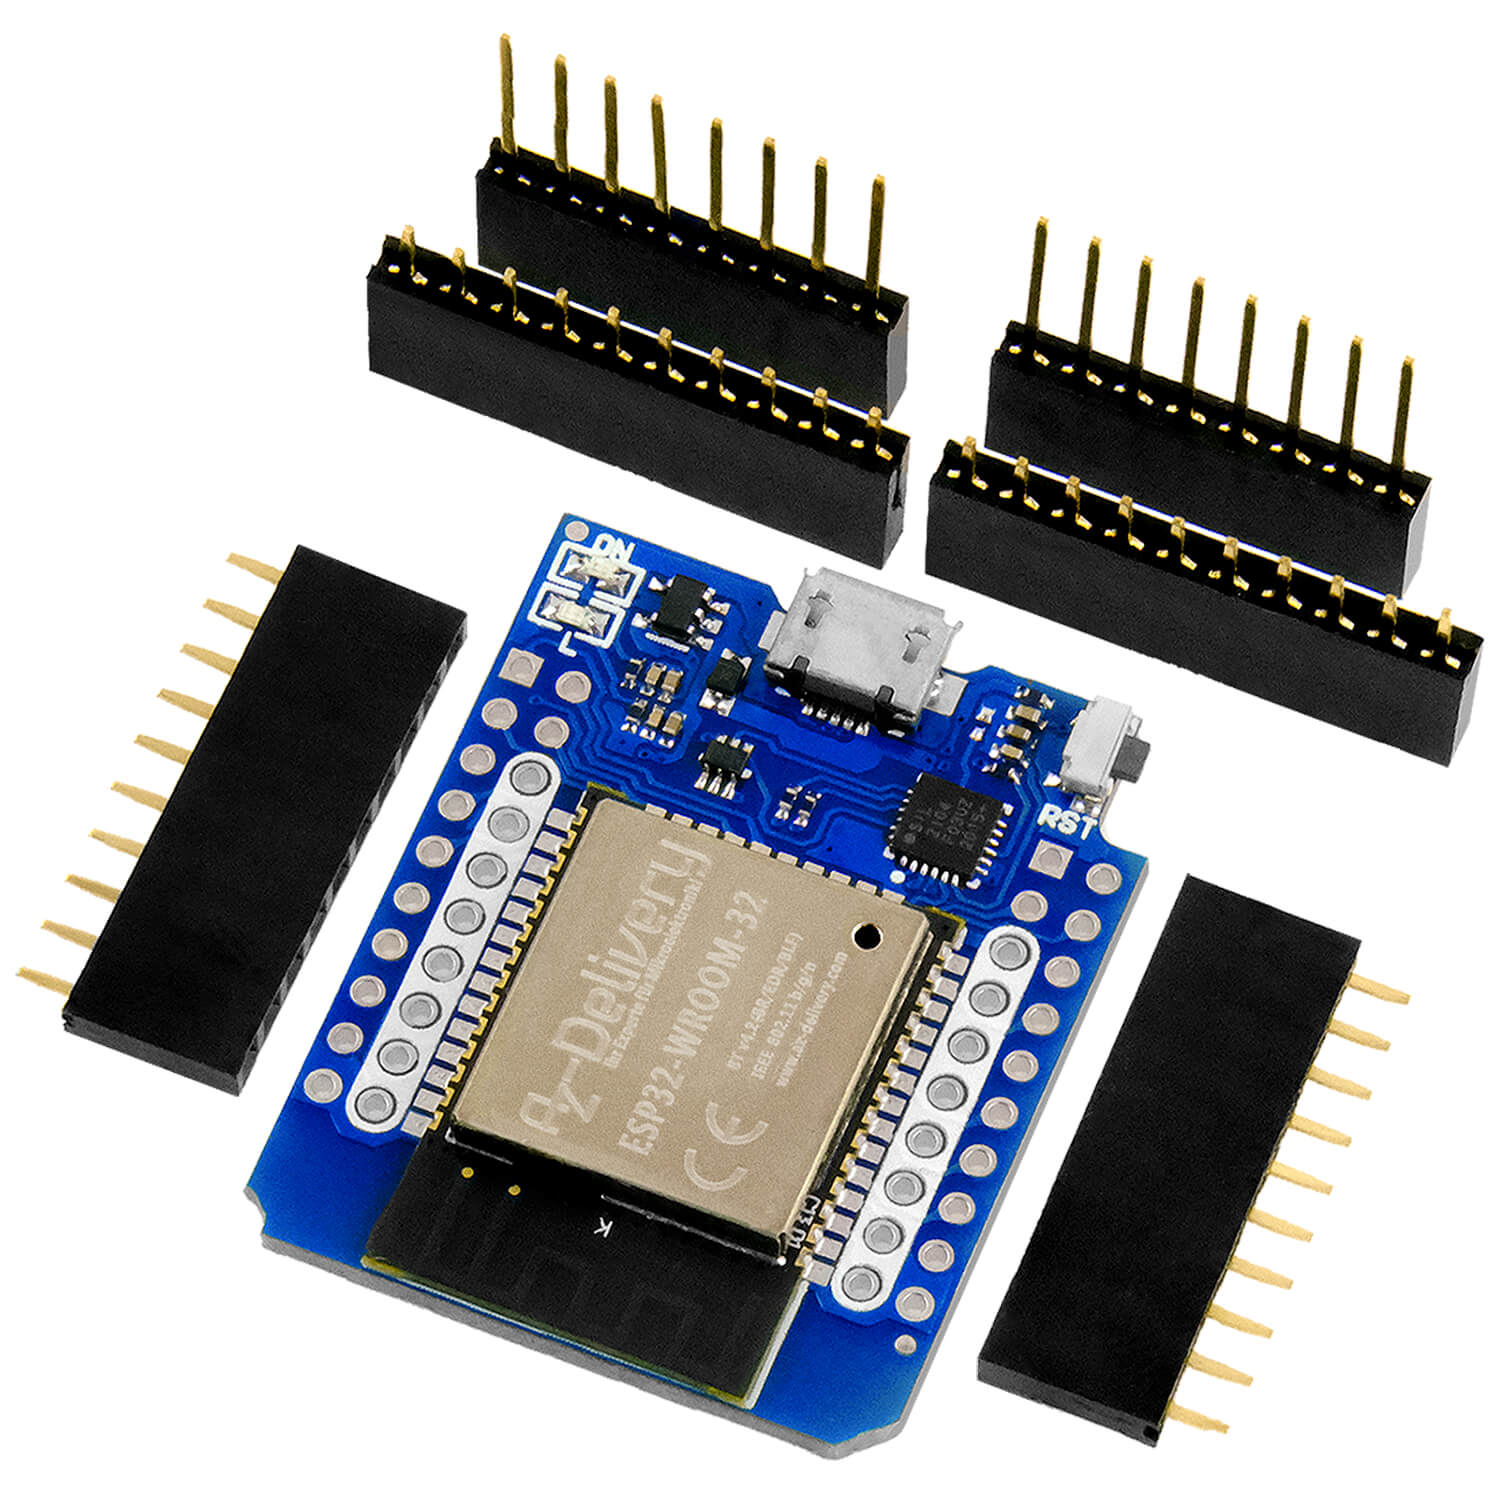
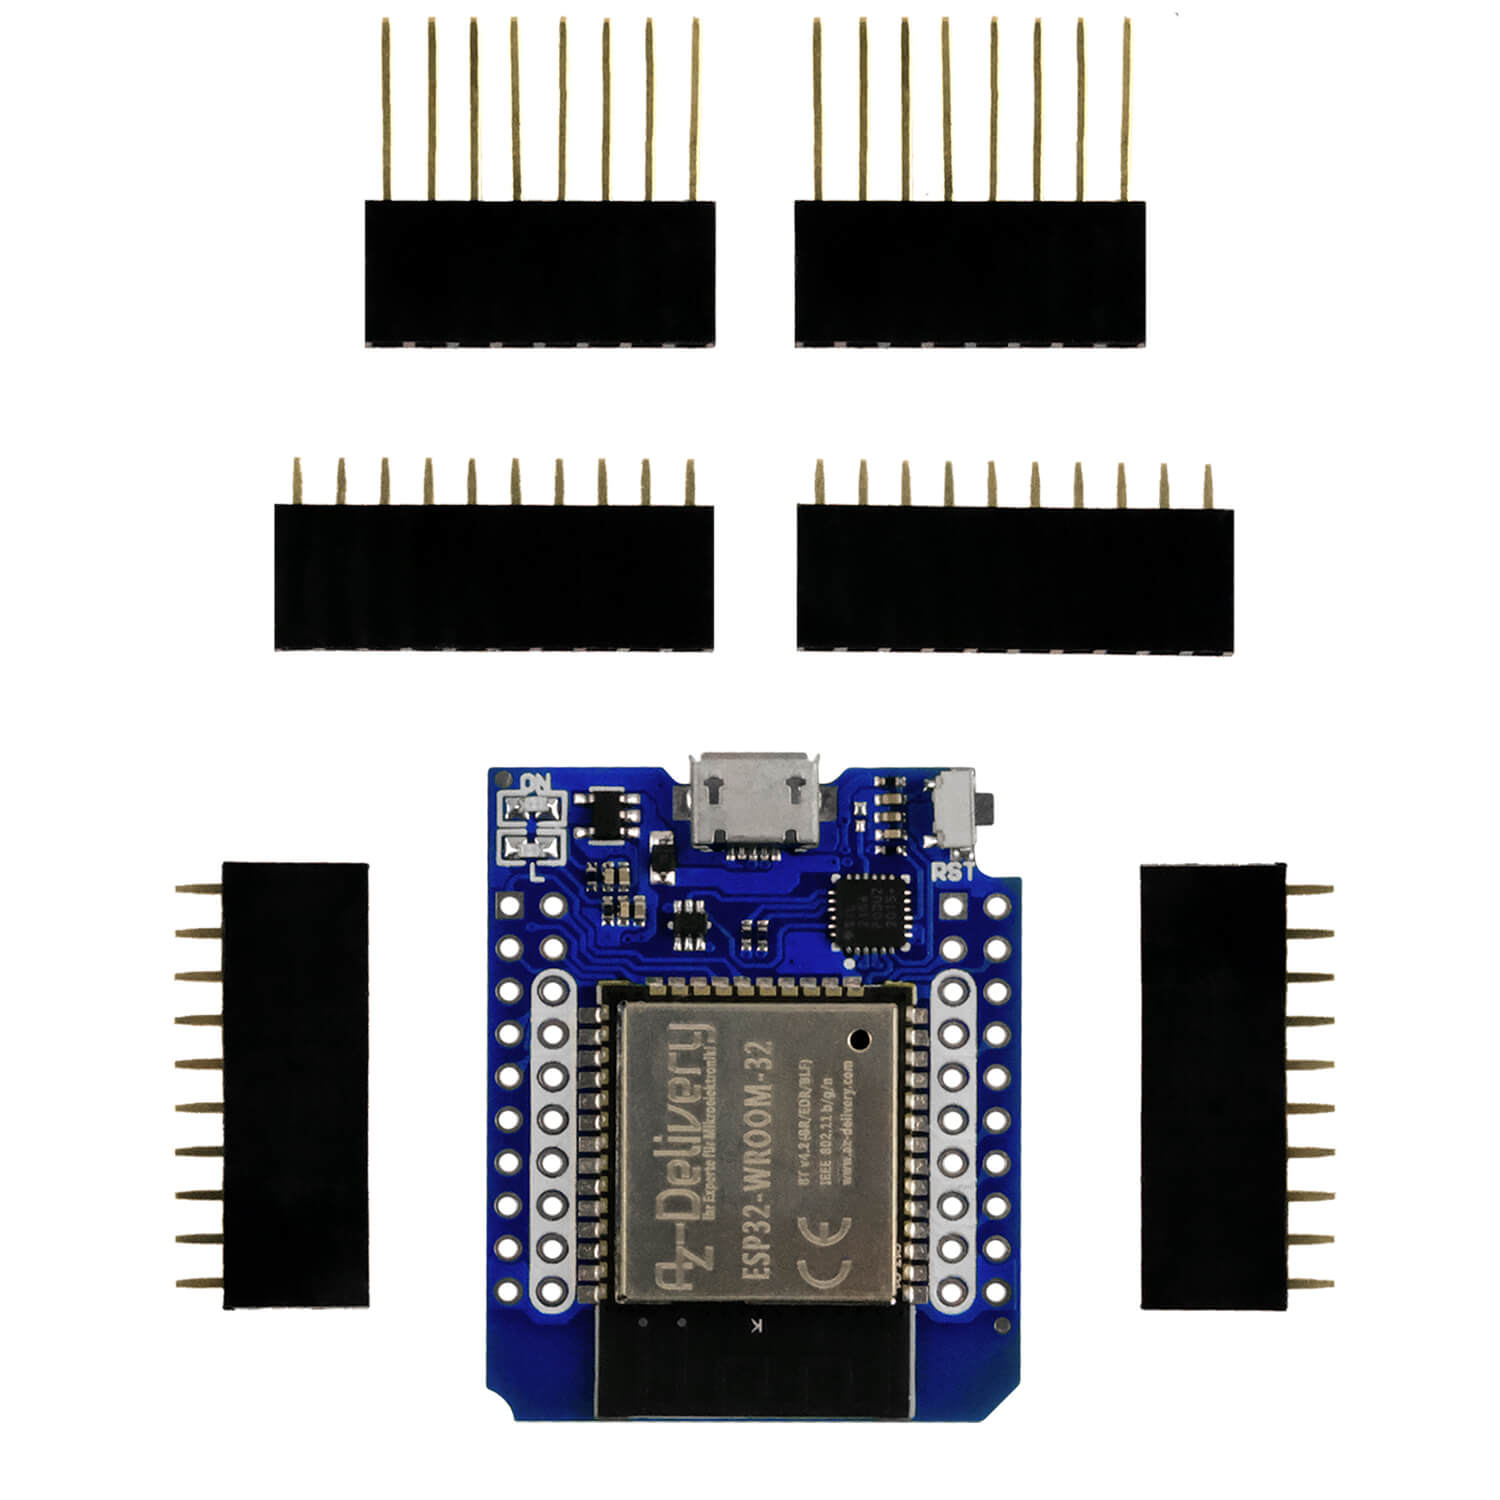


4 comentarios
Bernd Albrecht
@ Aurelien: Without detailed description of the used hardware, it is difficult to find the proper answer. In general: First problem is the kind of display driver to find the best suited library. Very common controllers are SSH1106 or SSD1306. These libraries offer a lot of possibilities. Therefore, best option is to find the library (subfolder Arduino/libraries) and select the display properties, first of all the resolution. Last general comment: Pixel counting starts in the upper left corner.
Aurelien Vanderstraeten
Hello,
I have follow the book to connect the screen to the arduino but it seems that the screen only works on a little part in the top. I have look on the internet to find an answer but i do not find anything. Could you help me please ? For exemple, i will just write “hello” on the screen but it didn’t work.
Thank you
Veit Burmester
Toller Artikel. Sehr gut erklärt. Die Herleitung der Formel perfekt beschrieben und für mich ( über 60 Jahre)
verständlich. Gerade die OLED- Display mit der Zeiger Anzeige macht was her. Trotz mehrerer Versuche die Anzeige rechts des oder links des Zeigers zu füllen ist mir noch nicht gelungen. Dann noch ein Farbwechsel in Abhängigkeit der Zeigerstellung wäre das Optimum.
Wenn jemand dazu eine Idee hat bitte veröffentlichen.
Viele Grüße und Weiter So
Tero Hemiö
Really nice and easy to follow blog. Thanks!