If you familiarize yourself with the basics of electronics, you will meet the term "vibration circle". Here we look at an LC-parallel swing circle. Such assemblies can still be found everywhere in radio /phono /hi-fi and TV devices. LC assemblies are also represented in motor vehicle electronics. In measurement technology anyway. Experts swear by analog filter of high quality, even if there have been digital filters with impressive properties.
If you want to operate electronics and computer technology, you should basically understand vibration circles.
Here we will Nano V3 use V3 with very little effort and periphery as an oscilloscope. By the way, you will get to know the "MSR laboratory", which is based on "Bare-Bone" C programming and much more, much more functions with the Nano V3 realized. It is impressive what you can do with it when you venture into the GCC compiler and dive very deeply. More on that later.
We need these parts for our small experiment:
Piece list
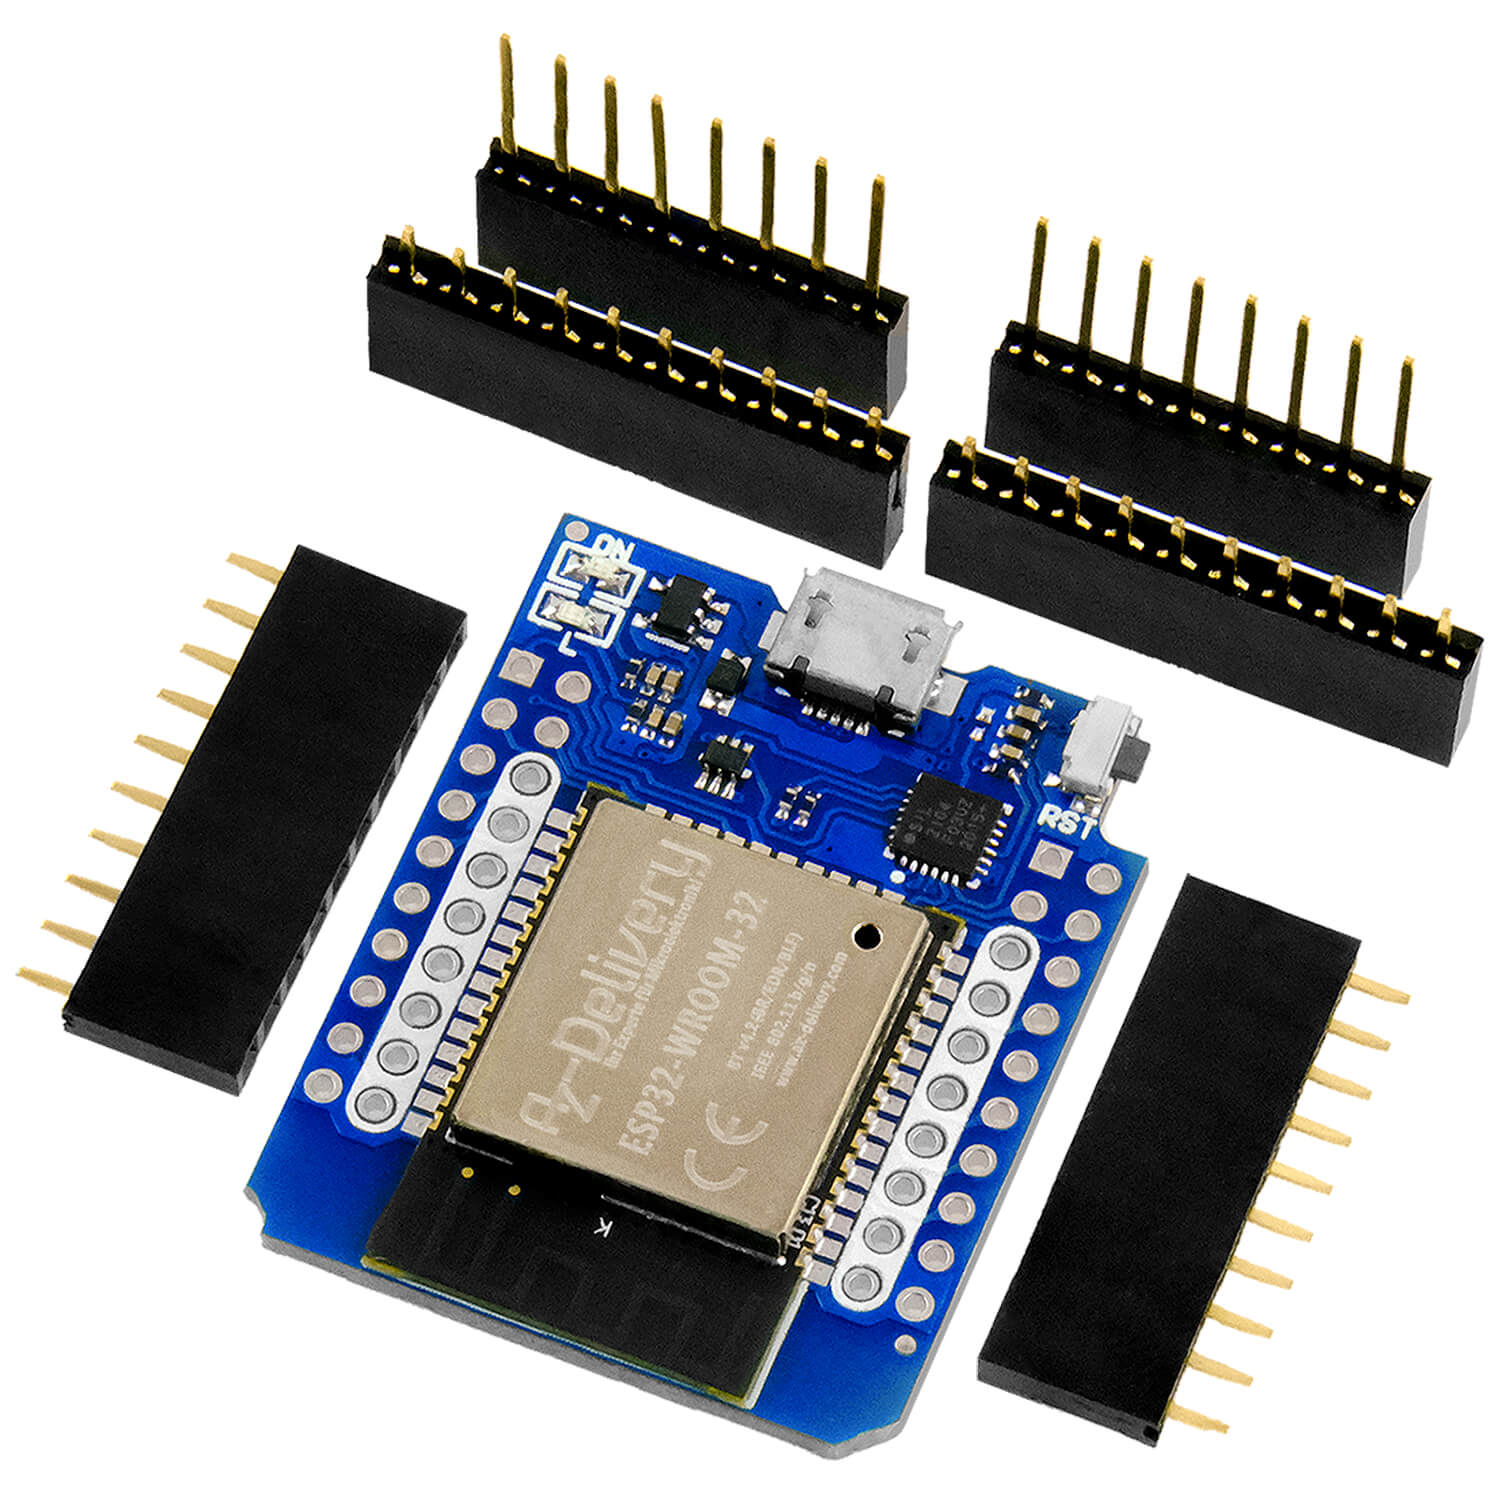
1 Nano V3 link
1 PWM signal generator link
1 OPAMM MCP602 link
1 Resistance 1kΩ, 0.25W link
1 Resistance 4.3kΩ, 0.25W link
1 Resistance 1MΩ, 0.25W link
2 capacitor 100nf link
1 capacitor 20nf link
1 capacitor 10NF link
1 electrolytic capacitor 2.2µF link
1 potentiometer link
1 Inductivity 1.35h see text
Recommended:
Expert book on the MSR laboratory link
What does an LC swing circle do?
A coil and a capacitor are switched in parallel. For example, it looks like this:

The resistance of 39 Ω, which is located in series with the coil, is the so -called "parasitic" ohmic resistance of the coil. You measure it with a multimeter. This resistance worsens the properties of the vibration circle. It comes about because many turns were wrapped in fine lacquer wire around a coil core. The vertical line shows the iron core of the coil on the switching symbol.
If we connect this vibration circle to a sinus generator and let the frequency of zero run up with constant amplitude, the so -called "resonance frequency" can be found in the so -called "resonance frequency" Fr A significant increase in the amplitude on the Schwingkreis. This is called the response. The phenomenon is also known from mechanics, where you often want to avoid resonances, e.g. so that a bridge does not break.
If you observe such a process with an oscilloscope - the frequency rises from left to right - then you can see the pronounced response.

If you know where on the X axis which frequency is located, you can read the resonance point directly.
A rather elegant procedure - also with the Nano V3 - Find here: https://art-of-electronics.blog/labor-tagebuch/#LC_Resonanz
Calculate the resonance frequency
The resonance frequency of the vibration circuit can be easily calculated:

L is the inductance of the coil, indicated in "Henry" [H]
C is the capacity of the capacity in "Farad" [f]
[F] is a size that is hardly used because there are only a few such large capacitors. Usually you use µf, NF, Pf.
If you don't want to calculate yourself, you can use a website, e.g.
https://www.redcrab-software.com/de/Rechner/Elektro/F0
If you would like to know more about vibration circles in general, you are in good hands here:
https://www.rahner-edu.de/grundlagen/signale-richtig-verstehen/schwingkreise/
Swinging circular quality
If you look at the photo of the oscilloscope above, you may have wondered why the "belly" of the picture is such a round "beer belly". With the term "response" you combine a pointed, high peak that goes very well beyond the basic signal.
How high the resonance peak is and how clearly it settles on the basic signal depends on the so -called "swing district quality", it is also called "resonance sharpness". The latter term says it: How sharp the response is depends on the Quality of the LC circle. The formula symbol for quality is Q - a dimensionless number.
The area on the left and right around the tip of the "abdomen", to which the amplitude has decreased by 3DB, i.e. the factor approx. 0.7, has decreased as the "bandwidth" of the vibration circuit.
The vibration area quality then calculates very easily: Q = Fr /Bandwidth
Since the resonance frequency is specified in [Hz] and the bandwidth, we receive a dimensionless number as a result.
The Nano V3 in use as an oscilloscope
So far the theory. If we want to measure the resonance frequency and the Q value of a vibration circuit, our would be ours Nano V3 as an oscilloscope a great solution.
However, if you look at the practical possibilities and calculate a little, disillusionment will soon spread. It is a very demanding task and can hardly be realized with the classic, comfortable IDE development environment.
Here I would like to tune the praise to one of our most experienced electronics technicians who have published a number of books, operates his own websites and, among other things, also solved our oscilloscope theme in a convincing manner: Mr. Burkhard Kainka. Its highly recommended websites are: http://elektronik-labor.de/ and http://www.b-kainka.de/. Under his name you will find a lot more online. Be sure to have a look - it's worth it.
Mr. Kainka has a complete electronics laboratory in the Nano V3 packed. The oscilloscope is only part of it. All parts of its "MSR laboratory" are created with the GCC compiler, as close to the hardware as possible. One - for me - incredible performance and really exhausting. You learn everything completely new if you have to do without the comfort of the IDE to get the necessary work pace. You program "Bare-Bone C". When generating a rectangular signal alone, Mr. Kainka's GCC sketch is Around 30 times as fast, Like a sketch only with the IDE.
If you want to load the oscilloscope (including the complete MSR laboratory), then the link (with the author's express approval) is: http://www.elektronik-labor.de/AVR/ArduinoMSR.html
Installation of the MSR laboratory
The MSR laboratory consists of the Nano V3 that communicates with a WIN computer - at 1 MB/s data rate! We are now installing all software for this.
If you only want to use the oscilloscope application, this should also be possible without the associated book by B. Kainka entitled "Arduino Messlabor". I donated the 15 € and am in the process of testing many of the functions offered. It is made professionally, more than sufficient for many purposes and an application that the Nano V3 uses to the limit of the possible.
The installation step-by-step:
- Visit the link http://www.elektronik-labor.de/AVR/ArduinoMSR.html
- Download the 300kb zip file zip Down and unpack them
- If you look into the "skipped" folders, you will find, among other things,:
Arduinomsr.exe
Arduinomsr2.exe
DDS1
DDS2
Lcfr.exe
Rscom.dll
MSR.ini
MSR2.ini
Nanomsr
Nanomsr2The "MSR" measuring laboratory works with the Nano V3 as the actual measuring device. There, signals are measured and also generated. The sketches in the folders DDS1 and DDS2 are signal generators, but they do not matter here.
The Front, which takes over the operation and represents the signals, is a VB6 application. It is that Arduinomsr2.exe (We only use the newer version ... MSR2).
In the company it remains Nano V3 remains connected to the laptop as an operating device. For this they start later Arduinomsr2.exe Laptop and Nano V3 communicate with 1MB/s via the serial interface. The instructions are groups of fewer bytes - hence the high pace.
- Now load the sketch ino Take a look at this compact sketch. Immediately it catches the eye that the classic structure Void Setup (), no one appears before (). Astonishing what the MSR2 does with less than 300 lines of code. A explanation of this "Bare-Bone C" codes can be found in detail for each individual function in the book mentioned on a total of 150 pages. The basics are explained there and numerous examples include. If you have loaded the sketch, simply compile and upload.
- For quick communication between Nano V3 and the PC may still have to do the right COM port in the file ini be entered. This is a pure text file. Please open this file and check whether the right COM port is already in it. If not, please change and secure. Make sure that the ending ".ini" is not lost.
- Now you can do the exe start. If an error message appears now, check point 5.)
You should already see the virtual oscilloscope and a lot of buttons and sliders that belong to the MSR2.
Everything done? Then the time has come - we can start with the measurements!
Our measurement structure
We see on the Breadboard next to that Nano V3 A few resistances from the AZ resistance range and two capacitors. A small 10kΩ trim potentiometer is added. For the 220nF conductor, we take 2x100nf + 1x20nf from the AZ ceramic condenser range and switch in parallel. The 2.2µF capacitor can be an ELKO. He has his plus pole on the left.

What you do not see here is the pulse generator that sends short rectangular impulses to our circuit via a 10NF condensa goal. It will be the PWM signal generator used for this. Because with this measurement we will proceed differently than in the article mentioned above from the Aoe blog. There you have added and looked at a sinus signal, at which frequency the vibration circle shows resonance.
This time we will be the vibration circle a single, short impulse send. With this we encounter the vibration, which gradually loses signal strength. This subdued vibration provides us with an elegant, simple measurement of the resonance frequency and also the vibration circuit quality.
Here I show how it looks on a classic oscilloscope:

You can see a very short impulse of around 15µs at the top - somewhat hidden behind the displayed number "100µs". This impulse comes from the PWM signal generator, which is set to a duty cycle of 3% at a frequency of 20 Hz. 97% of the time is his signal "low", 3% high.
Directly to the falling flank of this pulse, a sine signal with approx. 1VPP follows on the lower channel, which is connected directly to the vibration circle, which decreases with every further vibration. In the left half of the picture you can see a complete vibration.
If you cushion a swing or pendulum, this is the mechanical equivalent to our unique "thrust". Nice to it: From such a picture alone, we can derive the parameters that determine the vibration circle.
Now we measure with that Nano V3 MSR laboratory
The goal is with that Nano V3 and the MSR laboratory, according to this result, to perform exactly, which is shown here on a classic oscilloscope. To do this, however, we need a small "sidestep". The classic analogoszilloscope (as above) can measure voltages up to 5 MV. Our Nano V3 is not designed for this. He needs a little support. We have to reinforce the signal of the vibration circuit for a proper representation, because it is a maximum of 1 VPP (VPP is called "Volt -Peak -Peak", the tension between the highest and smallest value of our sine wave).
The little preamplifier can be seen on the cutboard. The simple circuit diagram looks like this:

Evaluation of the measurement
We used a coil of 1.35h and a capacitor of 220nf. This results in a resonance frequency of 292.04 Hz.
Now let's see what our MSR laboratory says:

- We have a period of 5 m between the vertical, green lines (x-axis) each
- Now let's see how many vibrations we find: I see 14 pieces.
- These 14 vibrations (from the 1st I still calculate ½) run in approx. 48.75 ms.
- This time is needed for 14 vibrations, so a vibration takes: 3.48 ms
- From this I calculate a frequency of Fr = 1/3.48 ms = 287.35 Hz.
The deviation 4.7 Hz goes to the account of the parasitic resistance, the coil capacity (the coil itself also acts as a capacitor) and other disorders.
In addition, the measuring device itself dampens the vibration circuit again and also brings a scatter capacity. The measurement also affects how closely the coupling between the Schwingkreis and the PWM generator is.
accuracy
We have a deviation - compared to the calculation - which is just 1.6%! And this with the simplest means, with minimal effort.
Calculate the vibrational quality
Now we want to determine the vibration circuit quality. For frequencies up to approx. 1 MHz, there is a simple rule of thumb when measuring with the subdued vibration, which is sufficiently precise:
- We see how many vibrations the signal fell over half. That seems to me to be the case after about 3 vibrations.
- This value is multiplied by the 5th result of this invoice, the coil quality: Q = 3 x 5 = 15.
If you look in the AoE blog, you will find a value of 12 for the identical circuit. Here we have a slightly larger deviation of approx. 20%.
Additions
There is a configuration file "MSR2" in the win programs that Mr. Kainka supplied. The COM port is entered there, which the main program should use "Arduinomsr2". If you receive an error message when you start the main program, please change the setting in the configuration file and restart the program.
You also get an application "LCFR.exe". This allows you to make a vibration circuit calculation.
I was asked in my blog where I got the inductance of 1.35 h. It is the throttle coil of a conventional fluorescent lamp that I switched to LED.
The small "air coil" - as a symbol in the plug -in view - is only "symbolic"!
Who for further applications of the MSR laboratory with the Nano V3 is interested in finding in the Art-of-Electronics Blog in the near future. I am currently developing additional hardware for the MSR laboratory, so that you don't have to build amplifiers on a Breadboard etc.
There will also be a detailed report on the MSR laboratory, perhaps even in collaboration with Mr. Kainka, who considered his work as an "open source" and expressly gave his "placet".


4 comentarios
Andreas Wolter
Herr Klein hat das Schaltbild aktualisiert und ausgetauscht.
Grüße,
Andreas Wolter
AZ-Delivery Blog
Bernd-Steffen Großmann
Hallo Herr Klein, vielen Dank für Ihre Antwort! Ja es stimmt, der Schaltplan ist viel eindeutiger. Ich bevorzuge als Elektroniker sowieso diese Darstellung vor den immer verbreiteteren “realen” Fritzing-Bildern. Leider fehlt die Anbindung des Impulsgenerators über den 10nF Koppelkondensator darin. Vielleicht können Sie das noch im Beitrag ergänzen, damit es eindeutig wird.
Noch mal zu meiner 2. Frage, die Sie leider nicht beantwortet haben: wo ist die positive Platte vom 2,2 uF Elko? Da (wie im Oszi-Bild oben ersichtlich) ein positiver Impuls den Schwingkreis anstößt, nehme ich inzwischen an, dass der Pluspol des Elkos am 10 nF Koppelkondensator bzw. am nicht invertierenden Eingang des OPV liegt, richtig? Viele Grüße von Bernd-Steffen Großmann
Michael Klein
Hallo Herr Großmann,
danke für die freundliche Rückmeldung :-) .. ich hatte ein wenig Sorge, dass der Beitrag vielleicht zu theoretisch rüber kommen könnte.
Sie haben völlig Recht: Die Fritzing-Darstellung könnte besser sein. Der Schaltplan hilft vielleicht ein wenig weiter: Der 1 MΩ-Widerstand verbindet des Abgriff des Trimmpotentiometers, das die Vorspannung für den OpAmp einstellt, mit dem nicht-invertierenden Eingang des OpAmp.
Der 10 nF-Kondensator ist einerseits mit dem Impulsgenerator verbunden und – diesen Teil erkennt man leider nur schlecht – sorry, mit dem anderen Beinchen direkt am Schwingkreis. Dort liefert er – galvanisch getrennt – seine Rechteckimpulse beim Schwingkreis ab. Man kann mit etwas Phantasie erkennen, dass der 2.2µF-Kondensator und ein Beinchen des 10 nF-Kondensators verbunden sind.
Viel Spass und viel Erfolg beim Nachbau,
viele Grüsse
Michael Klein
Bernd-Steffen Großmann
Hallo Herr Klein, ich hab mich mal wieder mit dem interessanten Projekt von Hr. Kainka „ Arduino-Messlabor“ befasst, einiges ausprobiert und nachgelesen. Dabei bin ich auch auf Ihren Beitrag gestoßen, der neue Aspekte und Möglichkeiten des o.a. Projektes aufzeigt. Das Ganze ist sehr lehrreich und interessant! Vielen Dank dafür! Allerdings habe ich beim Nachvollziehen der Schaltung zur Schwingkreis-Messung einige Probleme: in der Fritzing Schaltung ist der 10 nF Kondensator, über den die Impulse vom externen Generator eingekoppelt werden, zwar eingezeichnet, aber es ist nicht zu erkennen, wo die zweite Seite angeschlossen ist. Ich vermute mal an dem 1MOhm Widerstand, der auf der linken Seite „in der Luft hängt“, der dann aber auch noch mit dem +OPV-Eingang verbunden gehört. Wenn ich genau hinschaue, sehe ich da zwei gestrichelte Linien, die wahrscheinlich die fehlenden Verbindungen anzeigen. Im u.a. Schaltbild ist der Teil gar nicht gezeichnet, so dass ich nur vermuten kann, wie es richtig ist. Noch eine zweite Frage: ist der Pluspol vom 2,2 uF Elko auf der Schwingkreis-Seite oder am OPV-Eingang? Links ist relativ, da der Anschluss vom Elko auf der Schaltung gerade anders herum als auf dem Breadboard gezeichnet ist.
Mit freundlichen Grüßen, Bernd-Steffen Großmann