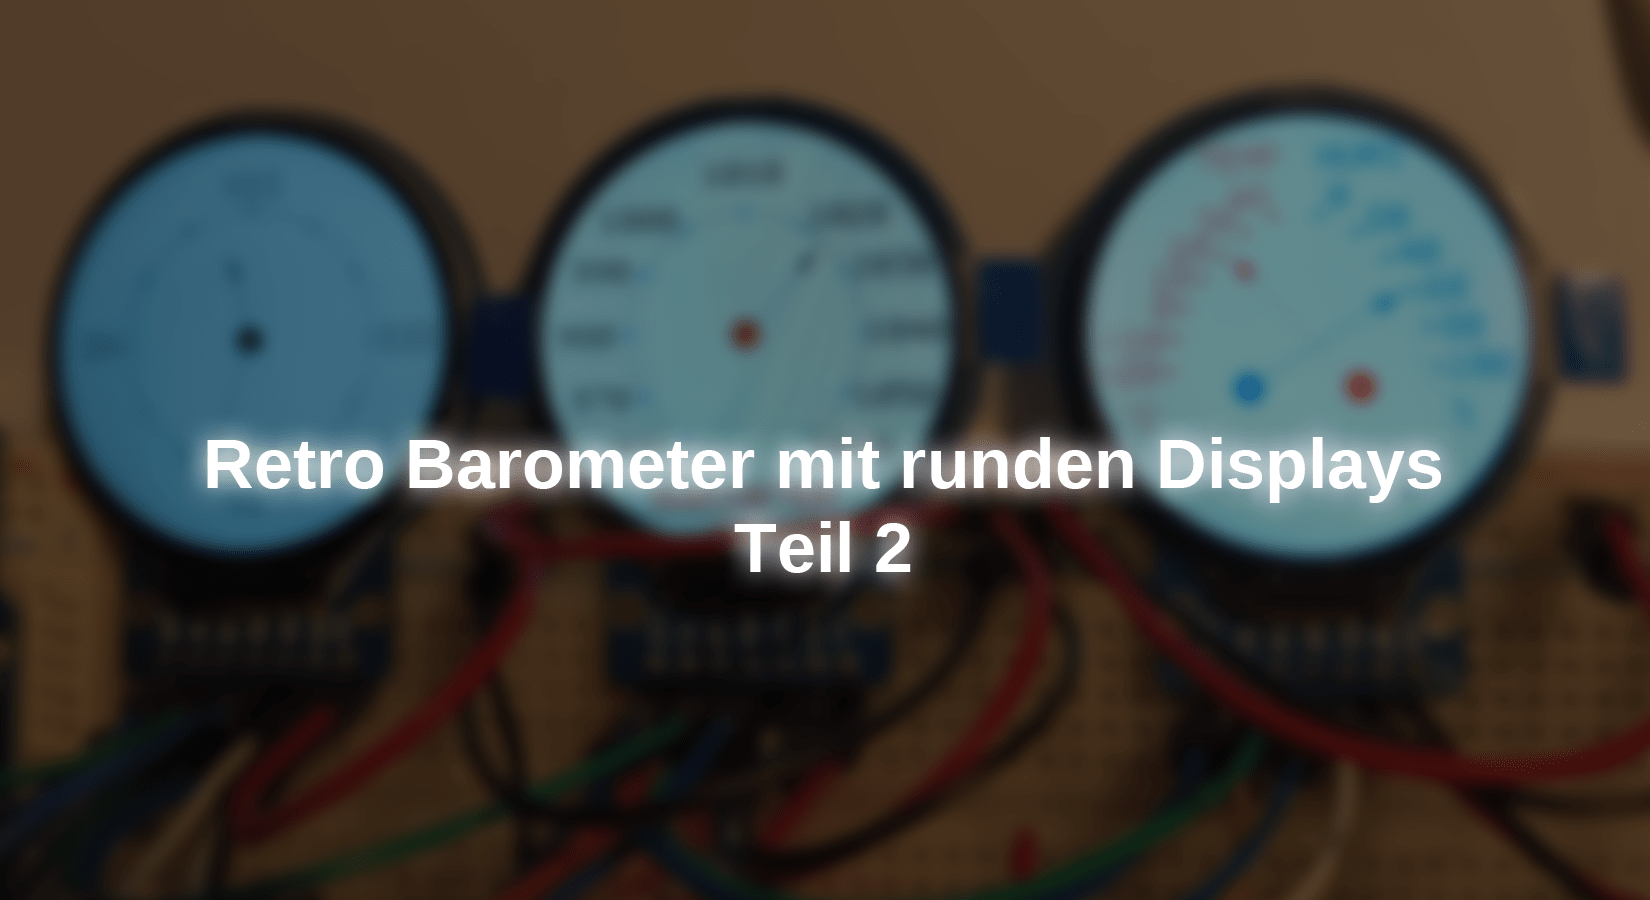
M first part We received the data from the sensors and the watch and presented them as characters on the displays. In the second part of the vintage barometer, we will implement the variables and methods that are necessary to present the readings of the humidity, temperature, atmospheric pressure and time on dials with scales.

The scale, which shows the value of the atmospheric pressure, is circular. The pressure value points with numerical value are thick blue dots. The intermediate points are much smaller, black and without values. The name of the size shown and the unit of measurement are given. The pointer ends in an arrow tip and marks the print value read by the BMP180 module.

The dial that shows the hours and minutes consists of two concentric circles, a circle showing the hour markings with blue dots and the other circle shows the minutes with smaller black dots. It is the typical dial with hours in Roman digits. The hours and minutes are marked with showers that end in arrowheads.

The temperature and humidity scale consists of two non-concentric circles. The value scales are arches of these circles and are opposite each other. On these arches, the value markings are shown as numbers and the value legends in red for the temperature and in blue for the humidity. The sizes are also specified at the top of the scale and the unit of measurement at the bottom of the scale. The values determined by the sensor are also marked by arrows.
In order for the needle to show the exact value, it must be positioned in the angle in which the tip points to the value. Unfortunately, there is no method in the libraries of the screen that represents angles. So we have to find a way to convert the value of the sensors and to display it with degrees radiant to the scope of the circle. For this conversion we will use operations with the sinus and cosine of the angles. This will calculate the coordinates in which the tip of the needle must be placed on the screen.

A bow is the measure of a central angle of a circle, the arch length of which is equal to its radius. On the other hand, the value of 1 degree of a circle is in an arch size of 0.0174533. As you can see in the drawing, the orange point of the circle can be calculated using cosine and sinus. This point will be a coordinate on the screen.
In this second part, the circles of the screens are created, with three methods used to present the figures from which each display is composed. With a method, a scope or an arch with the value scale is shown, with another method a small circle is represented, which represents the pivot point of the needle. These two methods are from the set up()**-Method called and a third method is a needle that consists of a line and a triangle at the end. This last method is from the loop()**-Methods called out that is continuously carried out. The hardware, software and the component scheme are the same as in Part 1. Only the sketch is different.
Used hardware
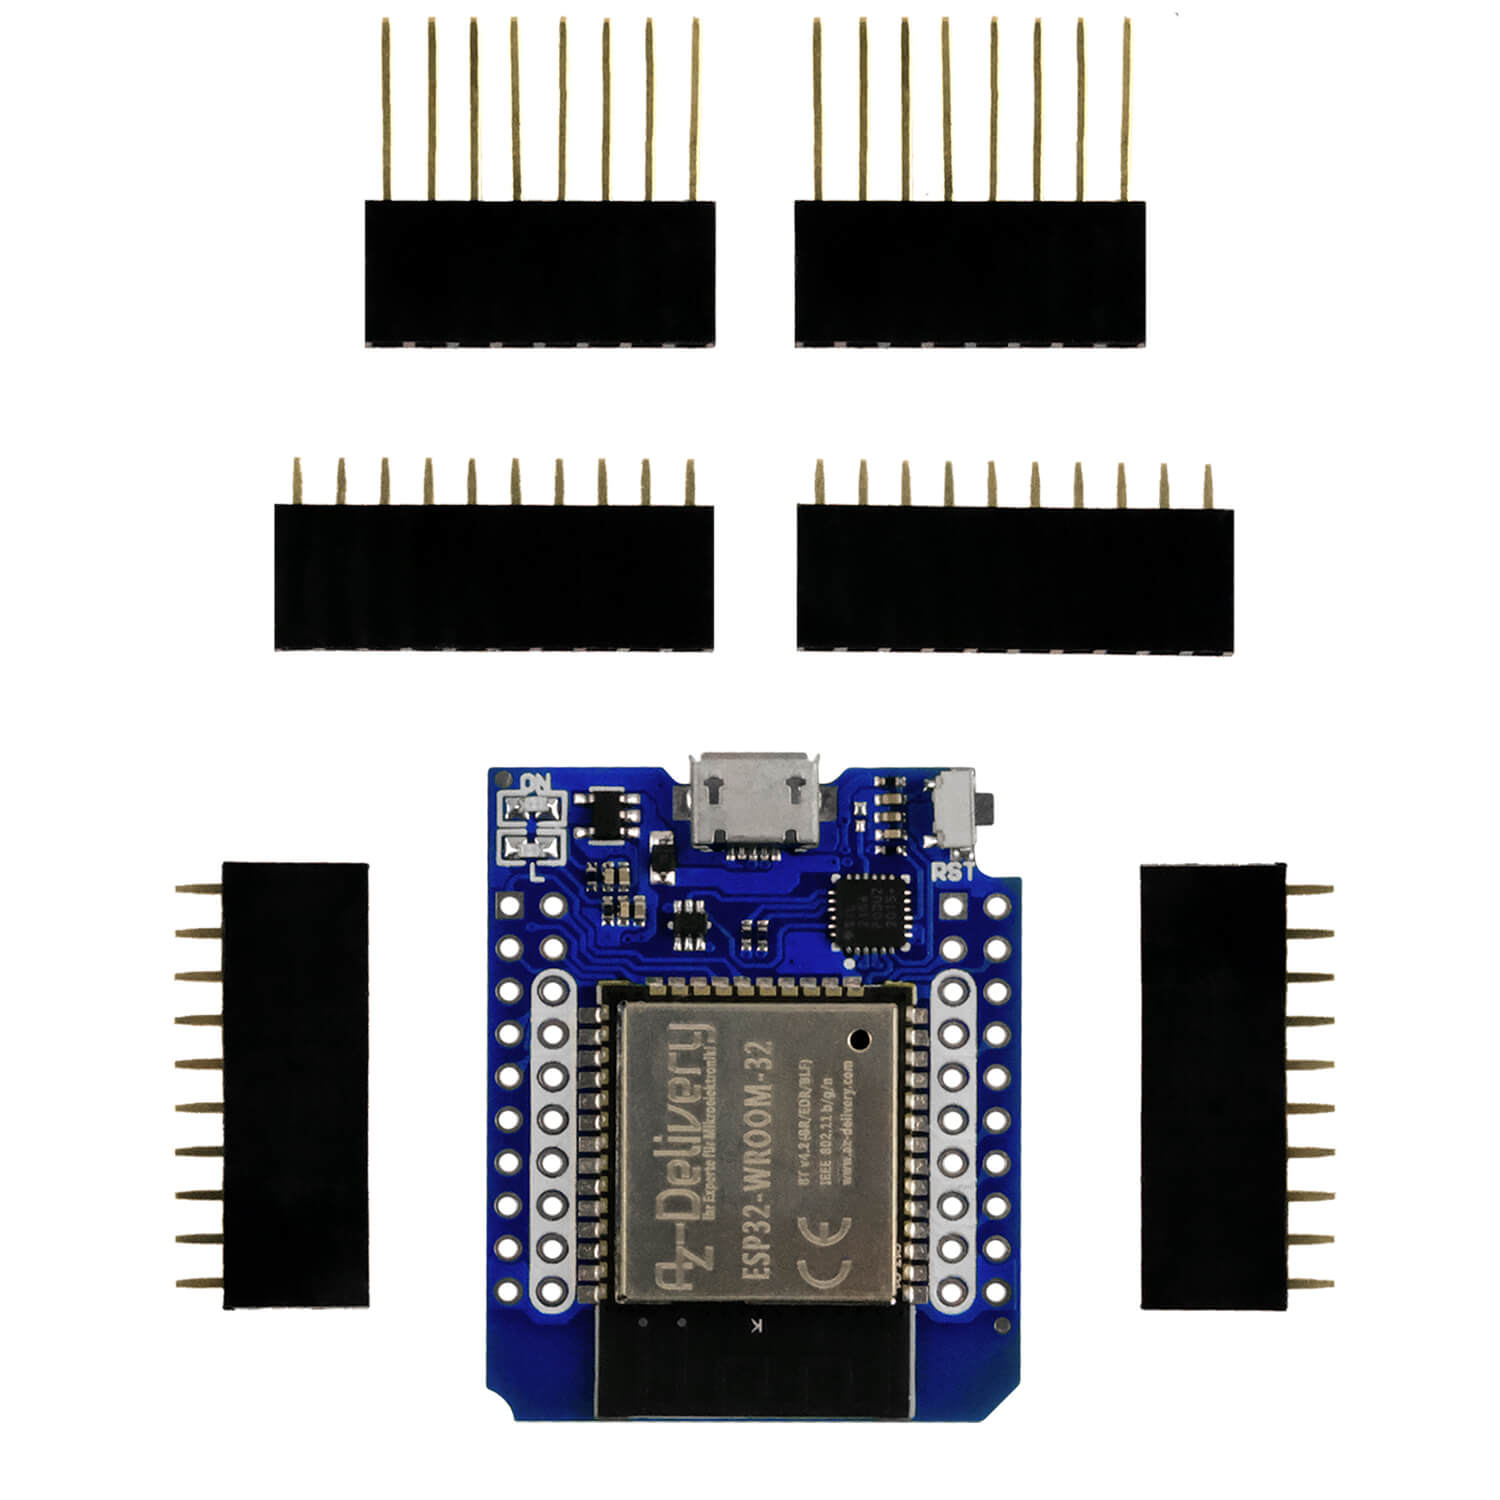
- 1 Microcontroller Board AZ-ATMEGA328 board with USB cable
- 3 GC9A01 1.28 inch round LCD-TFT display
- 1 DHT22 AM2302 Temperature sensor and air humidity sensor compatible with circuit board and cable
- 1 GY-68 BMP180 barometric air pressure and temperature sensor
- 1 Real Time Clock RTC DS3231 I2C real -time clock
- 1 SYB-1660 solder-free Breadboard Protoboard | Breadboard kit | Tie-Point 1660 ZY-204 | 4 power railways
- 1 MB102 Breadboard Power supply Power Supply module 3.3V/5V
- Jumper Wire Kabel 40 pc. 20 cm m2m male to times each
Required software, libraries and sketch
- Arduino id
- Wire library (wire.h, this library is included in the Arduino IDE)
- Spi library (Spi.H, this library is included in the Arduino IDE)
- Adafruit GFX library (through the board administrator, Adafruit_gfx.h)
- Adafruit GC9A01A library (about the board administrator, Arduino Adafruit_gc9a01a.h)
- BMP180 library (Download of the library from AZ-Delivery)
- Rtclib.h library (Adrafruit/rtclib.h)
- Dht.h library (Adafruit/DHT sensor-library)
- vintage_weather_atmega328_graphics.ino
Circuit and description of the modules used

Analysis of the sketch
We start analyzing the program code. First of all, as in the first part, the necessary libraries have to be included in the section for the definition of the global variables in order to be able to use the modules used. The configurations and methods necessary for measurements are located in these libraries. Some paragraphs are repeated from part 1.
The first library to be added is <Wire.H>, This library enables communication between devices via the I2C bus, which is used by the barometer module BMP180 and the DS3231 o'clock. The next library to be added is "Spi.H". This library enables communication with devices with SPI pins, such as B. TFT screens, whereby the microcontroller is the master device. The next library is "Adafruit_gfx.h". This is the main graphics library for displays. It provides the necessary methods for drawing primitive graphics (points, lines, circles, etc.). The fourth added library is "Adafruit_gc9a01a.h". It offers the necessary configuration and support for the GC9A01A display driver. The libraries <Bmp180.h> that is required to work with the barometer module, "Rtclib.h" For the watch module and
#include <Wire.h>
#include "Spi.H"
#include "Adafruit_gfx.h"
#include "Adafruit_gc9a01a.h"
#include <BMP180.h>
#include "Rtclib.h"
#include <Dht.h>
The next four lines are constant that are used to implement the TFT display objects. The numbers of the microcontroller pins are used to use the data to be sent to the displays tft_dc 7 and tft_cs_pressure 10 defined, tft_cs_clock 2 and tft_cs_temperature 3 Define the microcontroller pins for the selection of the screen on which the information of the individual sensors is to be displayed. Definitions are pre -processor commands, the values of which are replaced in the source code at the beginning of the compilation process, where the name was entered.
#define tft_dc 7
#define tft_cs_pressure 10
#define tft_cs_clock 2
#define tft_cs_temperature 3
Now an object has to be created for each screen in order to be able to work with you. For this purpose, a name is declared and the pins of the microcontroller to which the screen is connected are declared. The names of the constants we have previously defined are entered here.
Adafruit_gc9a01a tft_Pressure (tft_cs_pressure, tft_dc);
Adafruit_gc9a01a tft_clock (tft_cs_clock, tft_dc);
Adafruit_gc9a01a tft_tememperature (tft_cs_temperature, tft_dc);
Four basic colors are used for the circular elements: black, blue, red and white, with their names and their numerical value in the coding RGB565. The value of each color can be under http://rinkydinkelectronics.com/calc_rgb565.php be called up.
#define Black 0x0000
#define Blue 0x001f
#define Red 0xf800
#define White 0xffffff
After the colors to be used, two important variables or constants are defined to calculate the coordinates of the values on the value scale and the position of the needle to display the value. A variable with the name pi, which contains the mathematical value PI. Also a constant with the name deg_to_rad. It contains the value in radiant, which has 1 degree of any scope.
#define DEG_TO_RAD 0.0174532925
float pi= 3.1415926535;
In order to receive temperature and moisture data from the DHT22 module, a sensor object must be implemented and the necessary variables must be defined. The first step is to define a constant that indicates the microcontroller pin to which the module's data pin is connected, as well as another constant that specifies the sensor model. Then a module object with the name dht Implemented, as a parameter, the microcontroller pin to which the signalpin was connected and the sensor model must be specified. These parameters are reproduced by the defined constants.
#define dht_pin 9
#define DHT_TYPE DHT22
Dht dht (dht_pin, dht_type);
After the module object has been created, variables for storing the data must be defined. In order to be able to display them on the screen, they must first be converted into character chains. Two variables are defined to save the temperature and humidity data read by the sensor, the names of which are easy to understand.
float Humi;
float Temp;
Before we continue with the sketch, we look at the coordinates of the GC9A01 screen. The display is round, but it is important to know that the point with the coordinates x = 0 and y = 0 is in the upper left corner of the pink square in the following picture. This means that the real screen would be a circular neckline of a square screen with a resolution of 240 px * 240 px.

The value scale for both the air humidity and the temperature is drawn as a circular arch, whereby the center of the air humidity circle has coordinates X = 89 and y = 150, while the center of the circle for the temperature scale has the coordinates X = 149 and y = 150. Only the circular arch, which is necessary, is drawn to display the required scale. In the figure you can see how the circles described are arranged.
Let's go with the sketch. We define the variables for the value scale and the needle marking of the temperature. The variables are Center_x_T temperature and Center_y_Temperature of the type intimately Created that are the values of the coordinates of the center of the scope to be used.
intimately Center_x_T temperature = 149;
intimately Center_y_Temperature = 150;
The full image of the needle consists of a line that begins in the middle of the circumference and ends with an arrow tip in the form of a triangle. In order to display the new position of the needle, the previous state of the needle must first be re -drawn with the background color of the screen. Therefore, variables of the type float Defined that contain the old coordinates and the new coordinates that result from the new values.
float pivot_x_t temperature, pivot_y_t temperature, pivot_x_temperature_old, pivot_temperature_y_old;
Variables are also defined for displaying the values of the DHT22 sensor.
float P1_X_T temperature, P1_Y_T temperature, p2_x_t temperature, p2_y_t temperature, p3_x_t temperature, p3_y_temperature;
float p1_x_old_temperature, P1_Y_OLD_T Temperature, p2_x_old_temperature, p2_y_old_temperature, p3_x_old_temperature, p3_y_old_temperature;
In the next two lines the variables are arc_x_temperature and arc_y_temperature of the type float Defined that contain the coordinates of the sheet drawing with the scale of the temperature values.
float arc_x_temperature;
float arc_y_temperature;
The variable needleangle_temperature of the type float the position of the temperature is contained in degrees. This is the angle between the value of the temperatures of the value scale and the temperature that the needle should mark.
float needleangle_temperature = 0;
The last two variables defined for the temperature are temperature of the type float, in which the value recorded by the DHT22 sensor is saved and needle_setter_temperature, also of the type float, in which the temperature to be set by the needle is saved.
float Temperature;
float needle_setter_temperature;
The same variables are defined for the moisture data as in the previous lines, but with the ending humidity.
intimately Center_x_humidity = 89;
intimately Center_y_humidity = 150;
float pivot_x_humidity, pivot_y_humidity, pivot_x_humidity_old, pivot_humidity_y_old;
float p4_x_humidity, p4_y_humidity, P5_X_HUMITITY, p5_y_humidity, p6_x_humidity, p6_y_humidity;
float p4_x_old_humidity, p4_y_old_humidity, p5_x_old_humidity, p5_y_old_humidity, p6_x_old_humidity, P6_Y_OLD_HUMITITY;
float arc_x_humdity;
float arc_y_humdity;
float needleangle_humidity = 0;
float humidity;
float needle_setter_humatity;
In the last line of the definitions for the temperature and air humidity display, the variable becomes Radius_T temperature of the type intimately Defined with which the radius of the circles are determined, which are contained the arches with the scale of the temperature and humidity values. The value of the radius' is 100 pixels.
intimately Radius_T temperature = 100;
The definition of the variables for the barometer module BMP180 begins with the implementation of an object for the sensor. In this case only the name has to BMP180 be specified. The variable pressu of the type float is also defined to save the value of the sensor.
BMP180 BMP180;
float Pressu;
The value scale for the BMP180 sensor is a single circle, the center of which is the middle of the 240 x 240 pixel screen, i.e. for coordinates X = 120 and y = 120.
intimately Center_x_Pressure = 120;
intimately Center_y_Pressure = 120;
There are also variables of the type float Defined to save the old and new coordinates of the needle -lines and to save the values of the coordinates of the position of the triangle of the arrowhead, which mark the value of atmospheric pressure.
float pivot_x_pressure, pivot_y_pressure, pivot_x_old_pressure, pivot_y_old_pressure;
float P1_X_Pressure, P1_y_Pressure, P2_X_Pressure, P2_y_Pressure, P3_X_Pressure, P3_Y_Pressure;
float p1_x_old_Pressure, p1_y_old_Pressure, p2_x_old_pressure, p2_y_old_Pressure, p3_x_old_Pressure, p3_y_old_Pressure;
The value scale will contain numerical points for the pressure values and legends. To display these points on the screen, two variables are defined for the coordinates. We define a variable with the radius for the scope of the value scala.
float arc_x_pressure;
float arc_y_pressure;
intimately Radius_Pressure = 65;
In order to be able to save the pressure value in the bow and to be able to display it in points on the value scale, the variable becomes needleangle_pressure defined. In addition, a variable needle_setter_pressure Defined to save the value of the pressure that the needle will mark.
float needleangle_pressure = 0;
float Needle_setter_Pressure;
The variable pressure_scale is defined for the pressure values in the value scale and to be able to display the scale on the screen. The last variable for this section that needs to be defined is pressure_module_calibration. It will reflect the difference that can exist between the measurement value of the BMP180 module and the measured value of a calibrated sensor.
intimately pressure_scale;
intimately pressure_module_calibration = 140;
Now only the variables need to be implemented that are required to manage the data of the RTC DS3231 module to display the hours and minutes on the screen. First an object is called RTC Implemented of the RTC DS3231 module to record the hour and minute data. In this second part the days of the week are not displayed, but that DaysoftheWeek array, which has already been created in Part 1, is left. This array is used again in Part 3.
Rtc_ds3231 rtc;
char DaysoftheWeek [7] [12] = { "Sunday", "Monday", "Tuesday", "Wednesday", "Thursday", "Friday", "Saturday" };
A variable for saving the hourly dates and two other variables for saving the updated minute data, as well as the previous minute data.
float time_h;
float time_m;
float time_m_old;
The dial consists of two concentric circles and two pointers, a pointer for the hours and one for the minutes. The center of this district will be the middle of the screen again, so here too the coordinates for the center of the circles X = 120 and y = 120 pixels.
intimately Center_x_clock = 120;
intimately Center_y_clock = 120;
The following variables are created for the old and new coordinates of the pivot point of the needles in order to draw the small circle of the pivot point. If it is not re -drawn, the marking of the previous needle position remains empty, this is used in Part 3.
float pivot_x_clock, pivot_y_clock, pivot_x_old_clock, pivot_y_old_clock;
As for the previous screens, variables for the tips of the two hands (hours and minutes) must be defined.
float P1_x_clock, p1_y_clock, p2_x_clock, p2_y_clock, p3_x_clock, p3_y_clock;
float p1_x_old_clock, p1_y_old_clock, p2_x_old_clock, p2_y_old_clock, p3_x_old_clock, p3_y_old_clock;
float p4_x_clock, p4_y_clock, p5_x_clock, p5_y_clock, p6_x_clock, p6_y_clock;
float p4_x_old_clock, p4_y_old_clock, p5_x_old_clock, p5_y_old_clock, p6_x_old_clock, p6_y_old_clock;
In addition, two variables are defined to save the coordinates of the position of the minutes and hours on the dial, as well as the radius of the scope of the value scale.
float arc_x_clock;
float arc_y_clock;
intimately Radius_clock = 72;
In the following variables, hours and minutes are stored in the bow, the values of the hours and minutes for the marking on the dial as well as the data of the hour and minute hands.
float needleangle_hours_clock = 0;
float needleangle_minutes_clock = 0;
float Hours_dial;
float minutes_dial;
float needle_setter_hours_clock;
float needle_setter_minutes_clock;
Now the method must set up()** be implemented. The first thing that is done in this method is the initialization of the serial monitor and the sending of an initialization message for screens and sensors.
Serial.Begin(9600);
Serial.print("Initialization of the Set of Sensors and Displays.");
The first screen with the method Begin()** the created object is initialized is the one who shows the temperature and humidity data. The rotation of the display is used with the method setrotation(0)** configured. The screen background is white and is used with the method Fillscreen(White) ** fixed.
TFT_T temperature.Begin();
TFT_T temperature.setrotation(0);
TFT_T temperature.Fillscreen(White);
The following two code lines are given the coordinates of the pivot point of the temperature needle. These coordinates are identical to the center of the circle, which is contained the scale of the temperature values.
pivot_x_t temperature = center_x_temperature;
pivot_y_t temperature = center_y_temperature;
At the beginning, the old ones are also the new values for the coordinates.
p1_x_old_temperature = center_x_temperature; P1_Y_OLD_T Temperature = center_y_temperature;
p2_x_old_temperature = center_x_temperature; p2_y_old_temperature = center_y_temperature;
p3_x_old_temperature = center_x_temperature; p3_y_old_temperature = center_y_temperature;
Exactly the same for displaying the air humidity.
pivot_x_humidity = Center_x_humidity;
pivot_y_humidity = Center_y_humidity;
p4_x_old_humidity = Center_x_humidity; p4_y_old_humidity = Center_y_humidity;
p5_x_old_humidity = Center_x_humidity; p5_y_old_humidity = Center_y_humidity;
p6_x_old_humidity = Center_x_humidity; p6_y_old_humidity = Center_y_humidity;
In order to display the scales of the temperature and air humidity values on the screen, the method is CREATE_DIAL_T Temperature () called, the method for displaying the pivot point of the temperature needle draw_pivot_temperatue () and with draw_pivot_humidity () The method for displaying the pivot point of the air humidity pointer.
CREATE_DIAL_T Temperature ();
draw_pivot_temperature ();
draw_pivot_humatity ();
The method CREATE_DIAL_T Temperature () Contains the display of the scale of temperature and humidity. I show the creation of the temperature scale here. The creation of the air humidity contains similar steps.
The first thing that is carried out is for (temperature = -20; temperature <40.1; temperature+= 10), this is one for loop, to show small red circles that start at -20 degrees Celsius and end at 40 degrees Celsius. The step width is 10, i.e. a red circle is to be drawn every 10 degrees. The first thing is the line within the loop needleangle_temperature = (temperature * deg_to_rad * 1) - 2.7 executed. This converts the value of the handed over to degrees to the size of the temperature scale. To do this, the temperature (temperature) with the value of 1 degree in arch dimensions (deg_to_rad) and with the distance (1) multiplied between the circles. The value of -2,7 is used to position the first value on the scale of the scale. The following figure shows a circle with the conversion values of degrees to an arch. To position the value of -20 degrees Celsius on the temperature scale of the screen, 2.7 degrees of arch must be deducted. The direction of the addition on the screen is clockwise.

for (temperature=-20; temperature<40.1; temperature+=10) {
needleangle_temperature = (temperature * deg_to_rad * 1) – 2.7;
}
As can be seen in the following illustration, we must carry out the calculations with the cosine to convert the arc size of the district scope in screen coordinates to calculate the coordinate on the X axis, and with the sinus for the Y coordinate.
The following figure shows again how to convert the arch dimensions of the district scope in screen coordinates. The cosine and for the y-coordinate of the sinus are used to calculate the X coordinate.
With the line arc_x_temperature = (pivot_x_temperature + ((radius_temperature + 4) * cos (needleangle_temperature))) the coordinate is calculated in pixels on the x-axis of the screen. The 4 pixels that are added to the radius of the circumference serve to move the point away and not every time the temperature value changes to have to call the method to display the scale. The line arc_y_temperature = (pivot_y_temperature + ((radius_temperature + 4) * sin (needleangle_temperature)))) is used to calculate the pixel coordinate of the y-axis of the screen.
arc_x_temperature = (pivot_x_t temperature + ((radius_t temperature + 4) * cos(needleangle_temperature));
arc_y_temperature = (pivot_y_t temperature + ((radius_t temperature + 4) * sin(needleangle_temperature));
After the X and Y coordinates of the counter of the for loop The transfer of the temperature value handed over, a red 2-pixel circle is displayed on the X and Y coordinates.
TFT_T temperature.Fillcircle (arc_x_temperature, arc_y_temperature, 2, Red);
When leaving the for loop, is the scale value legend with TFT_T temperature.print ** ("Temp"**)** Added, the text color with TFT_T temperature.SettextColor ** (Red), with TFT_T temperature.SettextSize ** (2) The font size on 2 and on the MIT TFT_T temperature.Setcursor ** (64, 16) set coordinates. The legends for the values of the individual points on the temperature scale are also added in red color, font size 2 and to the coordinates specified for each value.
For the highly positioned symbol "O"For degrees Celsius, a small red circle of 2 pixels and a concentric circle of 1 pixel is inserted in the background color of the screen.
TFT_T temperature.SettextColor (Red);
TFT_T temperature.SettextSize (2);
TFT_T temperature.setcursor (64, 16);
TFT_T temperature.print ("Temp");
TFT_T temperature.SettextColor (Red);
TFT_T temperature.SettextSize (2);
TFT_T temperature.setcursor (80, 38);
TFT_T temperature.print ("40");
. . . . .
. . . . .
. . . . .
TFT_T temperature.SettextColor (Red);
TFT_T temperature.SettextSize (2);
TFT_T temperature.setcursor (29, 159);
TFT_T temperature.print ("C");
TFT_T temperature.Fillcircle (24, 161, 2, Red);
TFT_T temperature.Fillcircle (24, 161, 1, White);
Within the method CREATE_DIAL_T Temperature () There is also the code required to display the moisture scale on the same display. The steps are exactly the same.
When the value scales have been displayed, the pivot points of the temperature and air humidity marker needles by calling up the methods are draw_pivot_temperature () and draw_pivot_humidity () called. In these methods, the only code line is to display a red or blue circle with a size of 8 pixels in the middle of the respective district scope.
TFT_T temperature.Fillcircle (pivot_x_t temperature, pivot_y_t temperature, 8, Red);
TFT_T temperature.Fillcircle (pivot_x_humidity, pivot_y_humidity, 8, Red);
At this point, the temperature and air humidity ball are already initialized and the value scales for these two sizes are displayed. The next code of the set up()**-The method is the initialization of the air pressure display. The steps are the same as the initialization of the display for the hour and minutes. The value scale is first created and then the pivot circle of the needle.
As soon as the three displays are initialized, the three modules that provide the data are initialized. The first module that is initialized is the DHT22 sensor module. Just call the method Begin()** of the object defined for this sensor.
dht.Begin();
The second sensor is the barometer module BMP180 by calling the init()**-S method of the BMP180 objects This sensor. It is with the serial monitor with Serial.println(**"BMP180 Init"**)** reported that this module is initialized. A condition uses a condition to check whether this module has the right address. The argument of the condition is negated, i.e. if the address of this module is not the one stored in the library, it will be fulfilled. The interior of the instruction is carried out. In this way, the error can be reported in the initialization of the module.
BMP180.init();
Serial.print("BMP180 Init");
IF (!BMP180.hasvalidide()) {
Serial.print("Error - Please Check the BMP180 Board!");
}
Das dritte und letzte Modul ist das RTC DS3231-Uhrenmodul. Dies geschieht über die Methode Begin()** des für dieses Modul erstellten Objekts. Die nächsten beiden Zeilen dienen der Konfiguration des aktuellen Datums und der Uhrzeit. Die Anweisung rtc.adjust**(**DateTime**(F(**Date**), F(**TIME**))** ruft die Datums- und Zeitdaten ab, die das Modul in seinem Speicher abgelegt hat. Wenn Sie das Datum oder die Uhrzeit anpassen möchten, müssen Sie die vorherige Zeile auskommentieren und den Kommentar zur Zeile rtc.adjust**(**DateTime**(2024, 9, 12, 23, 33, 0))** remove. In den Argumenten müssen Sie die Werte Jahr, Monat, Tag, Stunde, Minuten und Sekunden manuell eingeben.
RTC.Begin();
RTC.adjust(DateTime(F(__DATE__), F(__TIME__)));
// rtc.adjust(DateTime(2024, 9, 12, 23, 33, 0));
Damit ist die set up()**-Methode beendet und die loop()**-Methode, die ständig ausgeführt wird, wird ausgeführt. Als erstes wird die now()**-Methode des DS3231-Modulobjekts aufgerufen. In order to obtain the current time, the function is snow.**house**()** used whose value in the variable Time_ H is saved. The function snow.**minute**()** is used to get the current minutes and is used in the variables defined at the beginning of the sketch time_m saved.
DateTime snow =RTC.snow();
time_h = snow.house();
time_m = snow.minute();
In order for the hour pointer to have the right hourly position on the dial, the passed minutes must be added to the hour. The dial has the markings for the 60 minutes, so that a position, the minute pointer, is moving a position every minute. In order for the hour pointer to move 60 positions in one hour, the minutes must be shared by 60. 60 positions are advanced from one hour to the next.
time_h = time_h + (Time_m/60);
The data for hours and minutes should be displayed in the serial monitor.
Serial.print(Time_H);
Serial.print(Time_m);
The screens update their data every minute, since the values of the BMP180 and DHT22 sensors do not change significantly in this short period of time. We also take advantage of the fact that the clock's minute hand has to change its position every minute. If this is the case, the interior of the curly brackets is carried out and the method is carried out refresh_screens () Called in which the screen data is updated. However, if the minute variable has not changed, we will return to the beginning of the method loop()** back there Else () is empty (the Else branch of the instruction can also be left out).
IF (Time_m != time_m_old) {
refresh_screens ();
} Else { }
When calling the method refresh_screens () In summary, reading the sensor value is carried out, the value is saved in the corresponding variable, and copied into the variable, which is responsible for displaying the pointer. Then the corresponding method for changing the position of the pointer is called. In order to update the data on the temperature and air humidity screen, the temperature must first be used with the method Reading temperature () read out of the sensor object and in the variable tempo be saved. The value is displayed by the serial monitor. To read the humidity, the method is readhumidity()** called up and their value in the variable humi saved, the value of which is also reported by the serial monitor. If the variables do not save value, the serial monitor reports the failure of the sensor.
tempo = dht.Reading temperature();
Serial.print("Temperature ºC ->");
Serial.print(Temp);
humi = dht.readhumidity();
Serial.print("Humidyty % ->");
Serial.print(humi);
IF (Isnan(Humi) || Isnan(temp)) {
Serial.print("DHT Sensor Read Failure !!!");
}
After reading and saving the temperature and humidity values, the value of the variables becomes tempo and humi In the variables needle_setter_temperature and needle_setter_humidity saved. These variables are used in the methods to position the needle, stating their values. For this purpose, the methods are Needle_Temperature () and Needle_humidity () called.
needle_setter_temperature = Temp;
needle_setter_humidity = Humi;
needle_temperature ();
Needle_humidity ();
The steps are the same to update the data on the air pressure and watch displays. It should be noted that there is only one difference in the variables of the minute pointer data. The dial has the display of 12 hours and 60 minutes. For the correct representation of the values, they must be between 0 and 12, so the handed over the hand on the basis of the two previous values must be converted. Therefore, the value of the minutes is multiplied by 0.2 in the line needle_setter_minutes_clock = time_m * 0.2. In this way, the real value of the minutes is adapted to the position that the pointer will mark. For example, the 30 minutes are marked in the 6 o'clock position and the 45 minutes in the 9 o'clock position.
In the last line of the method refresh_screens () becomes the current value of the variables time_m In the variable time_m_old saved to the minute examination in the if-else condition the method loop()** to carry out.
If the method Needle_Temperature () To update the pointer position with the new temperature data, the current state of the pointer is first called up with the white background color of the screen, ie "deleted". Then the pointer is shown red again to mark the new value.
With the following lines, the line and the tip of the pointer are newly drawn in white.
TFT_T temperature.drawline (pivot_x_t temperature, pivot_y_t temperature, p1_x_old_temperature, P1_Y_OLD_T Temperature, White);
TFT_T temperature.Fillriangle (P1_X_OLD_T Temperature, P1_Y_OLD_T Temperature, p2_x_old_temperature, p2_y_old_temperature, p3_x_old_temperature, p3_y_old_temperature, White);
With the stored temperature data, the position of the sheet value of this temperature must be calculated on the arch drawn on the value scale. This calculation is carried out in the following line.
needleangle_temperature = (Needle_setter_T temperature * deg_to_rad * 1) - 2.7;

If the position of the temperature value has been calculated to the extent to the extent, the coordinates of the needle must be calculated on the screen and saved in its variables. To display the needle, you must know the coordinates of the pivot point (pivot_x_t temperature and pivot_y_t temperature), the tip of the pointer (P1_X_T temperature and P1_Y_T temperature), the left apex of the triangle at the top of the pointer (p2_x_t temperature and p2_y_t temperature) and the right parting point (p3_x_t temperature and p3_y_t temperature). The coordinates are calculated with sinus and cosine, as described in the presentation of the value scale.
P1_X_T temperature = (pivot_x_t temperature + ((radius_t temperature - 1) * cos(needleangle_temperature));
P1_Y_T temperature = (pivot_y_t temperature + ((radius_t temperature - 1) * sin(needleangle_temperature));
p2_x_t temperature = (pivot_x_t temperature + ((radius_t temperature - 16) * cos(Needleangle_Temperature - 0.05)));
p2_y_t temperature = (pivot_y_t temperature + ((radius_t temperature - 16) * sin(Needleangle_Temperature - 0.05)));
p3_x_t temperature = (pivot_x_t temperature + ((radius_t temperature - 16) * cos(Needleangle_Temperature + 0.05)));
p3_y_t temperature = (pivot_y_t temperature + ((radius_t temperature - 16) * sin(Needleangle_Temperature + 0.05)));
The data is in the corresponding variables and also for the old coordinates (e.g. p1_x_old_temperature) saved when the pointer has to be "deleted".
p1_x_old_temperature = p1_x_temperature; P1_Y_OLD_T Temperature = p1_y_temperature;
p2_x_old_temperature = p2_x_t temperature; p2_y_old_temperature = p2_y_temperature;
p3_x_old_temperature = p3_x_temperature; p3_y_old_temperature = p3_y_temperature;
In order to display the needle in the new position and to mark the new value on the value scale, a red line from the pivot point to the arrowhead is first shown.
TFT_T temperature.drawline (pivot_x_t temperature, pivot_y_t temperature, P1_X_T temperature, P1_Y_T temperature, Red);
Then a red triangle is drawn as the tip of the arrow.
tft_temperature.filltrianangle (p1_x_temperature, p1_y_temperature, p2_x_temperature, p2_y_temperature, p3_x_temperature, p3_y_temperature, red);
TFT_T temperature.Fillriangle (P1_X_T temperature, P1_Y_T temperature, p2_x_t temperature, p2_y_t temperature, p3_x_t temperature, p3_y_t temperature, Red);
The procedure for presenting the pointers of the other sizes is similar to that. The code is described in a sketch with comments.


outlook
Part 3 of this project is to be added to a fourth screen on which the day of the week, the date, the condition of the sky are displayed depending on the air pressure and the moon phase.
Stay tuned!


3 Reacties
Martin
Hallo, ich habe den link zum zu diesem Projekt in meinen Projekt im Readme verlinkt!
Andreas Wolter
@Martin: das sieht sehr gut aus. Dein Link ist nicht korrekt. Ich habe deine Seite besucht und den korrekten Verweis gefunden:
https://github.com/Mosei1984/Wetterstation2/tree/main
Falls das Projekt hier als Grundlage diente, könntest du den Beitrag bei dir verlinken? Für den Autoren und seine Arbeit. Ich schreibe deine Verlinkung mit in den Beitrag.
Grüße,
Andreas Wolter
AZ-Delivery Blog
Martin
Hallo ich habe einen Stepper hinzugefügt der 2 Figuren antreibt wie bei einem wetterhäuschen , https://github.com/Mosei1984/Wetter-Station/tree/main/wetterstation2