In the past, there were small weather stations in some houses that indicated the humidity, air pressure and temperature for the area in question in the form of balls. These balls were framed in panels and hung on the walls. With time and technical development, these instruments were forgotten because the news programs and the Internet offered meteorological information for the whole country.
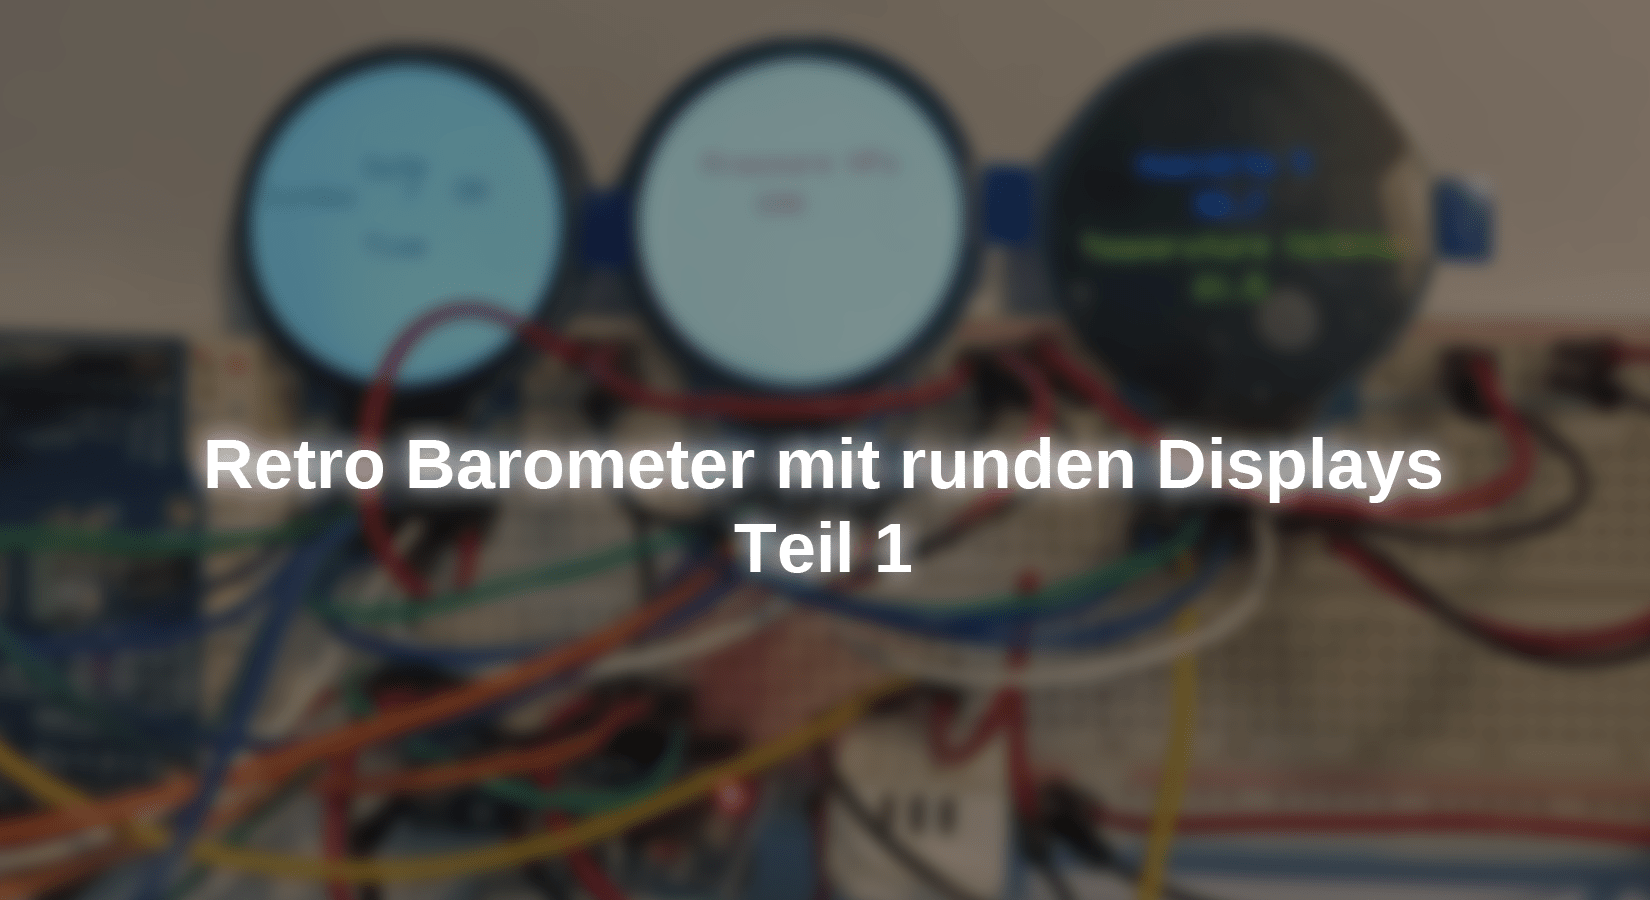
With this project we will revive this practical instrument by producing an electronic weather station in vintage style. It is a Springfield weather station with a wooden production. This weather instrument is vertical and will have four dials. The upper display shows the current time, the second offers a possible picture of the state of heaven according to the air pressure, the day and date and the moonstand. The third indicates the temperature in degrees Celsius and the percentage of the air humidity and the fourth and last the air pressure in HPA. Similar to the old analog instruments, the values are shown with pointers.

Round 1,28-inch TFT displays of the type GC901 are used for the dials. The versatile module DHT-22 is used to measure temperature and humidity and the module GY-68 BMP180 to measure atmospheric pressure. The RTC module DS3231 is used to get the current hour and minutes, as well as the current date. These modules are fed with the MB102 power supply for Breadboards because the outputs can be configured to 5 VDC and 3.3 VDC, the latter being used for the power supply of the modules.
This project was divided into three parts to get a simple overview of progress, from the recording of the sensor values to the creation of the "balls" with the values to the final project with the four displays.
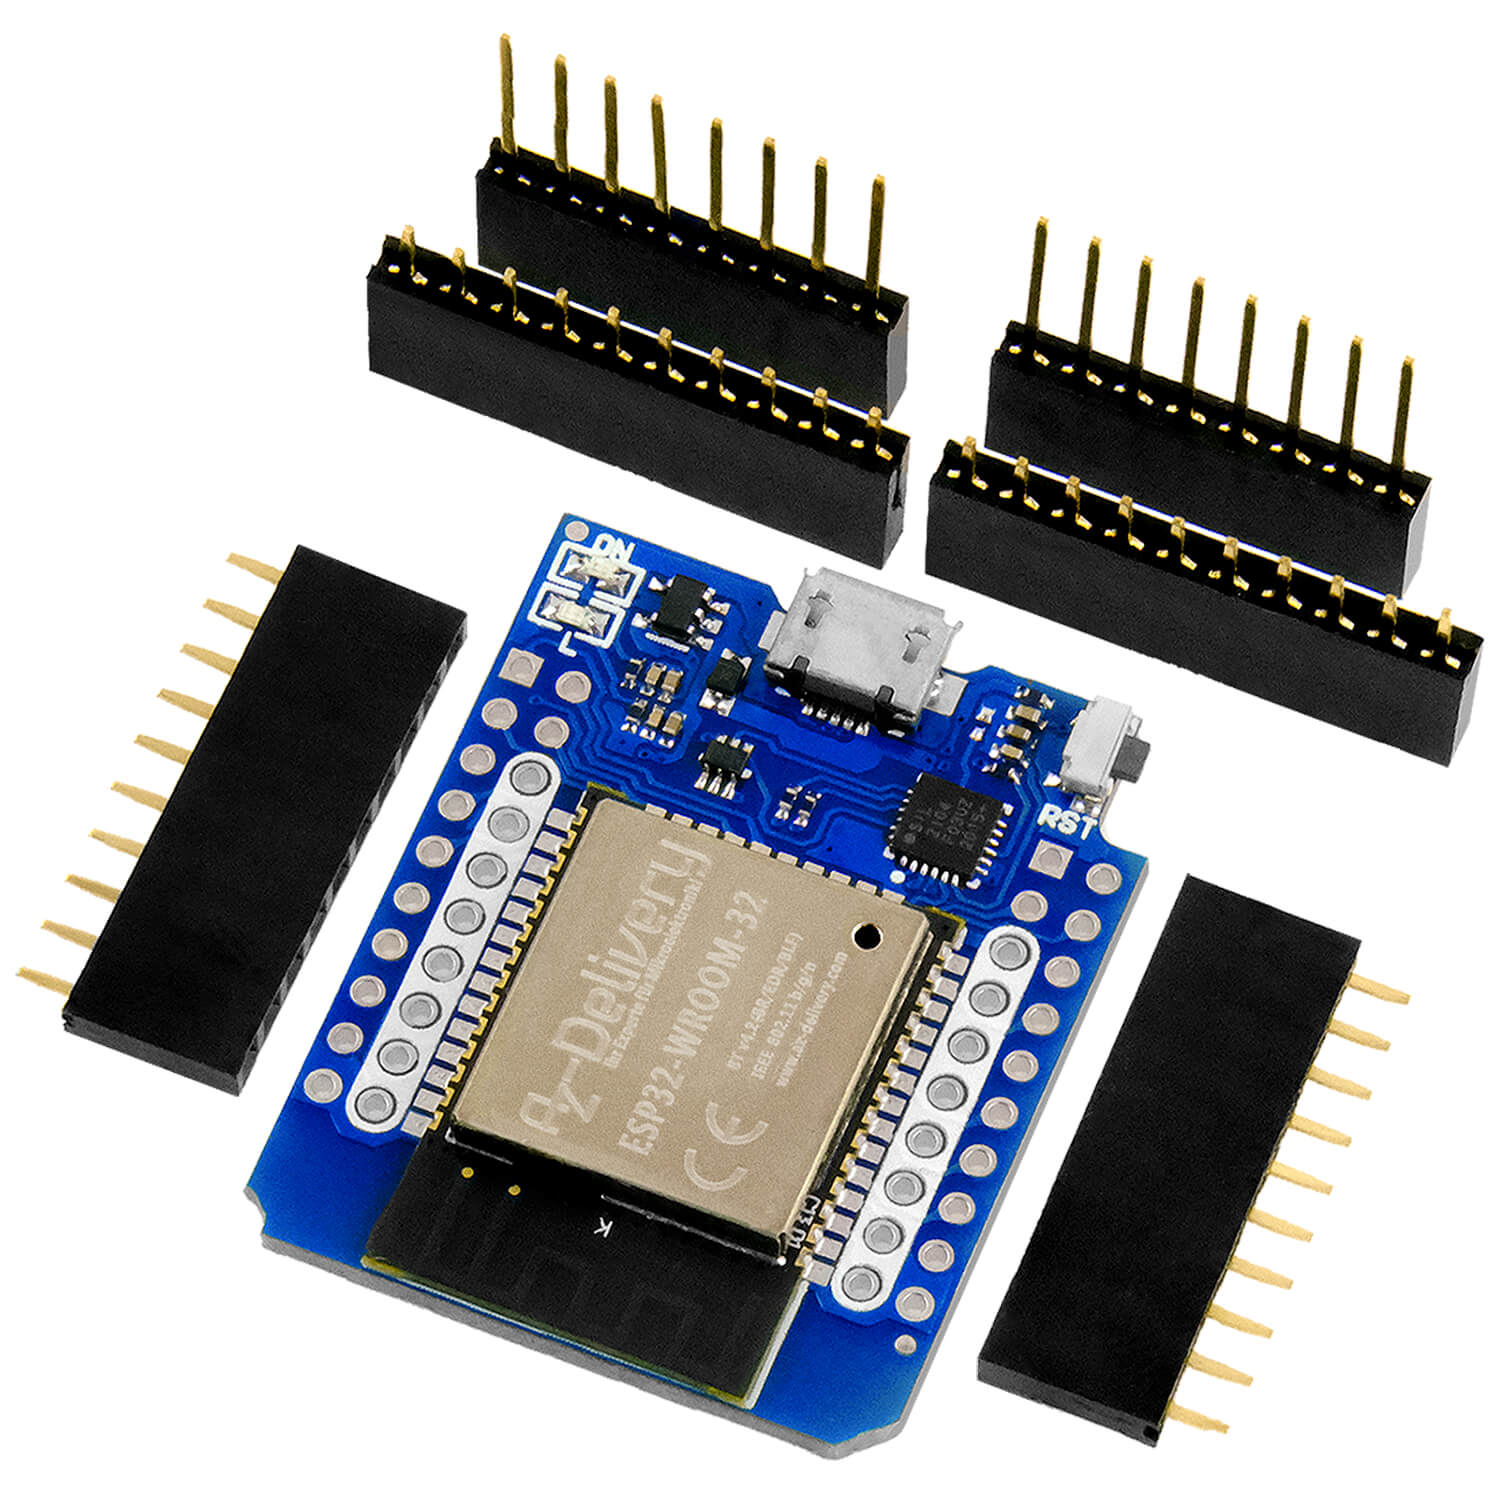
In the first part, the sensors and the microcontroller AZ-ATMEGA328 are used to maintain the values and display them on the screens. In the second part, the display of these methods is changed to the display with the measuring areas and in the third part the microcontroller is changed to an ESP-32 DEV Kit C, as well as a new screen added, which indicates the condition of the sky, the date, the weekday and the condition of the moon depending on the day. The microcontroller must be changed due to the storage. The sketch exceeds the storage capacity of the AZ-ATMEGA328. In addition, the user can implement new functions into the project.
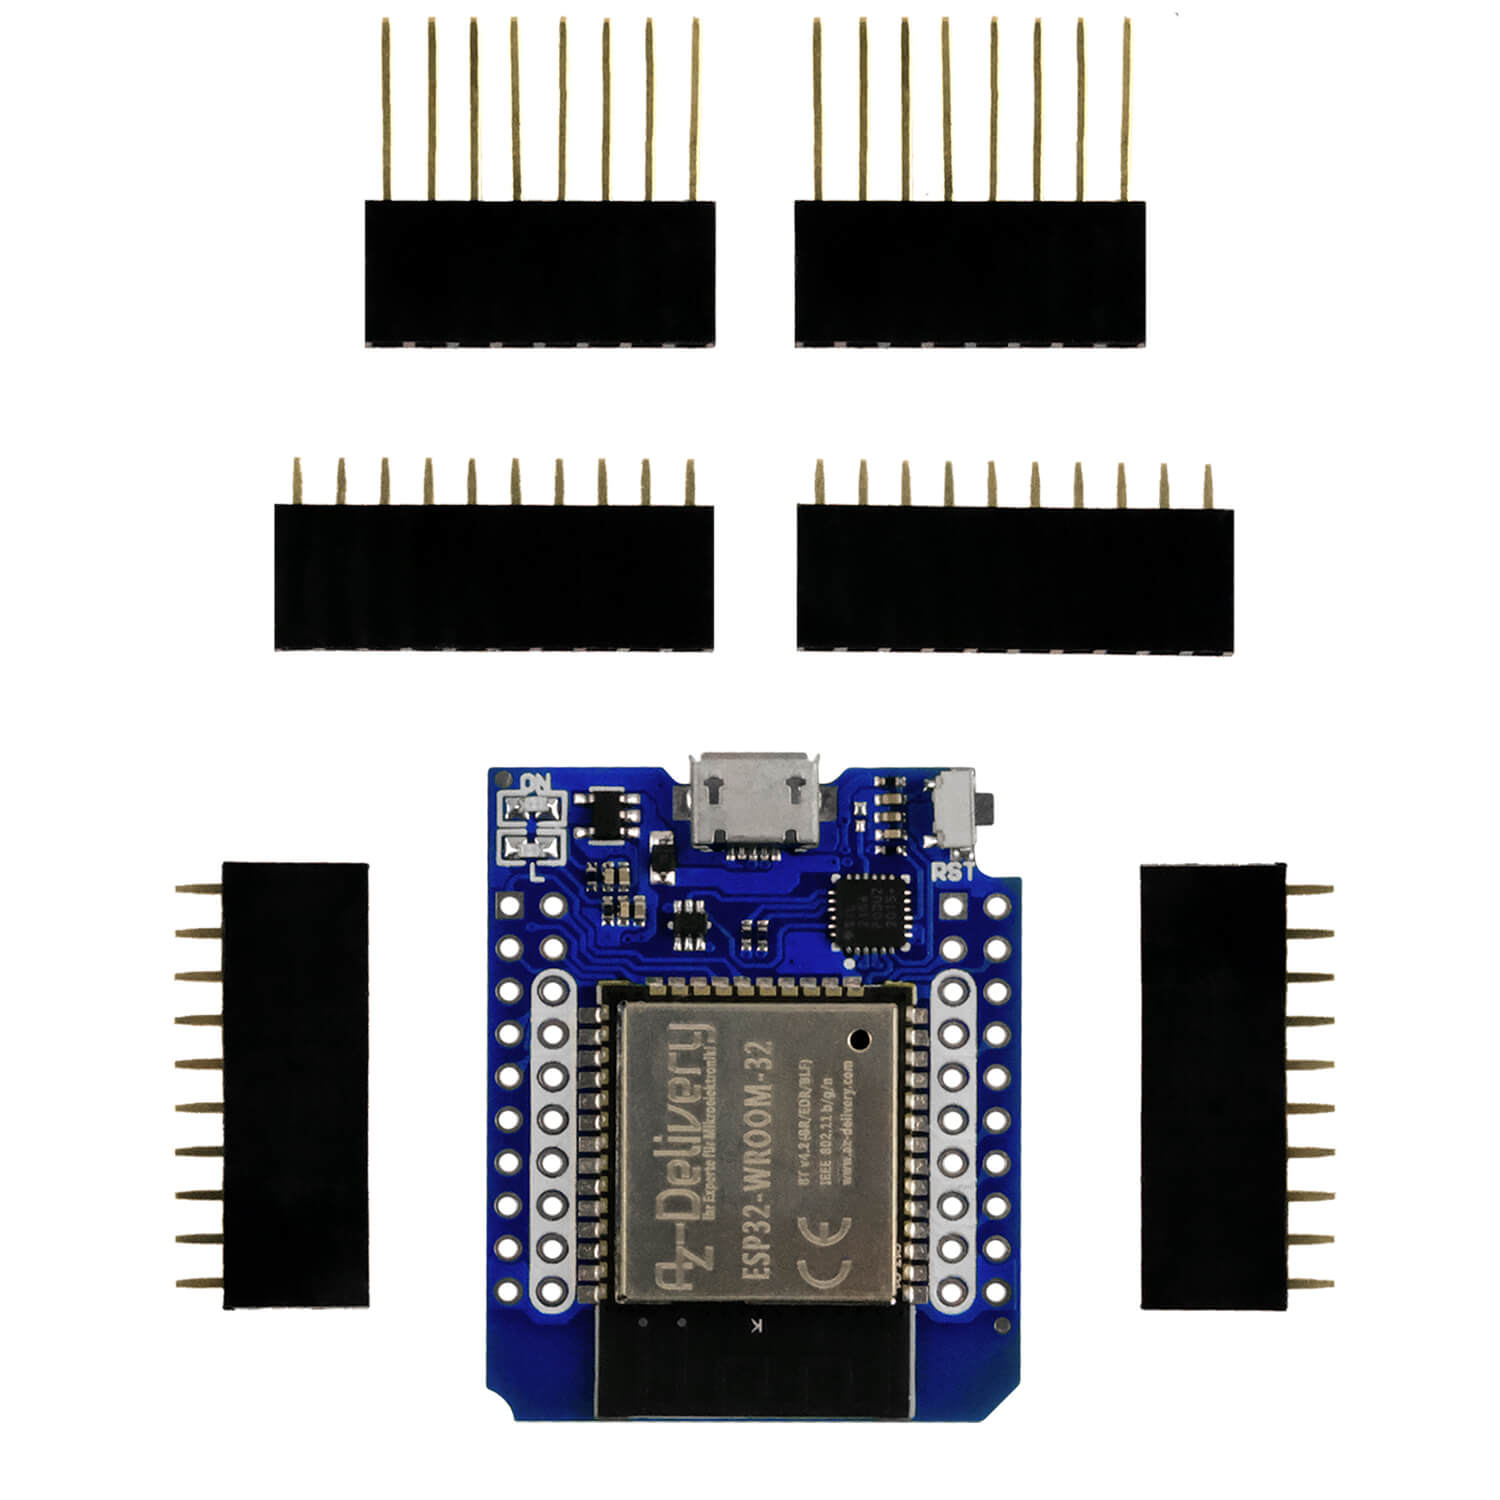
Used hardware
- 1 Microcontroller Board AZ-ATMEGA328 board with USB cable
- 3 GC9A01 1.28 inch round LCD-TFT display
- 1 DHT22 AM2302 Temperature sensor and air humidity sensor compatible with circuit board and cable
- 1 GY-68 BMP180 barometric air pressure and temperature sensor
- 1 Real Time Clock RTC DS3231 I2C real -time clock
- 1 SYB-1660 solder-free Breadboard Protoboard | Breadboard kit | Tie-Point 1660 ZY-204 | 4 power railways
- 1 MB102 Breadboard Power supply Power Supply module 3.3V/5V
- Jumper Wire Kabel 40 pc. 20 cm m2m male to times each
Required software, libraries and sketch
- Arduino id
- Wire library (wire.h, this library is included in the Arduino IDE)
- Spi library (Spi.H, this library is included in the Arduino IDE)
- Adafruit GFX library (through the board administrator, Adafruit_gfx.h)
- Adafruit GC9A01A library (about the board administrator, Arduino Adafruit_gc9a01a.h)
- BMP180 library (Download of the library from AZ-Delivery)
- Rtclib.h library (Adrafruit/rtclib.h)
- Dht.h library (Adafruit/DHT sensor-library)
- vintage_weather_atmega328_Characters.ino
Circuit and description of the modules used


To determine the temperature and humidity values, the module was DHT22 AM2302 used whose out signal pin is connected to the PIN D9 of the microcontroller. To measure the atmospheric pressure, the barometer module is BMP180 used and to get the current time and the date, this will RTC module DS3231 Real Time Clock used. These two modules communicate with the microcontroller via the I2C bus. The associated SDA and SCL pins of the modules are with the pins A4 and A5 of the AZ-ATMEGA328 microcontrollers tied together. The fact that the two modules are connected to the same pins is not a problem, since each module has a clear address to which the microcontroller can access. In this case, these addresses (BMP180: 0x77 and DS3231: 0x68) are defined in the libraries that are implemented at the beginning of the sketch.
For the visualization of the measured values of the previous modules, several are 1.28 inch GC9A01 Used that communicate with the microcontroller via the SPI bus. In order to select the screen on which each measured value of the modules is to be displayed, the CS pins (chip select) of each screen must be connected to their own PIN of the microcontroller. The other pins of the screens RST (reset), DC (data), SDA (MOSI), SCL (clock) are connected to the same pins of the microcontroller.
The configuration of the output voltage of the MB102 power supply With the help of the jumper, attention must be taken into account. The pins off and 3.3V are circulated in such a way that there is an output voltage of 3.3VDC at the output for the modules.
Description of the functioning of the project and sketch of the first phase
As soon as the modules are initialized, they continuously send the measurements obtained to the microcontroller, which shows them with alphanumeric characters on the screens. To select the screen on which every value of the modules is displayed, it must be selected via the PIN of the microcontroller.
The first thing that should be done at the beginning of a sketch for any project is to include the necessary libraries in the section of the definition of the global variables in order to be able to use the modules used.
The first library to be added is < Wire.h>, This library enables communication between devices via the I2C bus, which is used by the barometer module BMP180 and the DS3231 o'clock. The next library to be added is "Spi.H". This library enables communication with devices with SPI pins, such as B. TFT screens, whereby the microcontroller is the master device. The next library is "Adafruit_gfx.h". DIES is the main graphics library for displays. It provides the necessary methods for drawing primitive graphics (points, lines, circles, etc.). The fourth added library is "Adafruit_gc9a01a.h". It offers the necessary configuration and support for the GC9A01A display driver. The libraries <Bmp180.h> that is required to work with the barometer module, "Rtclib.h" For the watch module and
#include <Wire.h>
#include "Spi.H"
#include "Adafruit_gfx.h"
#include "Adafruit_gc9a01a.h"
#include <BMP180.h>
#include "Rtclib.h"
#include <Dht.h>
The next four lines are constant that are used to implement the TFT display objects. The numbers of the microcontroller pins are used to use the data to be sent to the displays tft_dc 7 and tft_cs_pressure 10 defined, tft_cs_clock 2 and tft_cs_temperature 3 Define the microcontroller pins for the selection of the screen on which the information of the individual sensors is to be displayed. Definitions are pre -processor commands, the values of which are replaced in the source code at the beginning of the compilation process, where the name was entered.
#define tft_dc 7
#define tft_cs_pressure 10
#define tft_cs_clock 2
#define tft_cs_temperature 3
Now an object has to be created for each screen in order to be able to work with you. For this purpose, a name is declared and the pins of the microcontroller to which the screen is connected are declared. The names of the constants we have previously defined are entered here.
Adafruit_gc9a01a tft_Pressure (tft_cs_pressure, tft_dc);
Adafruit_gc9a01a tft_clock (tft_cs_clock, tft_dc);
Adafruit_gc9a01a tft_tememperature (tft_cs_temperature, tft_dc);
In order to receive temperature and moisture data from the DHT22 module, a sensor object must be implemented and the necessary variables must be defined. The first step is to define a constant that indicates the microcontroller pin to which the module's data pin is connected, as well as another constant that specifies the sensor model. Then a module object with the name dht Implemented, as a parameter, the microcontroller pin to which the signalpin was connected and the sensor model must be specified. These parameters are reproduced by the defined constants.
#define dht_pin 9
#define DHT_TYPE DHT22
Dht dht (dht_pin, dht_type);
After the module object has been created, variables for storing the data must be defined. In order to be able to display them on the screen, they must first be converted into character chains. Two variables are defined to save the temperature and humidity data read by the sensor, the names of which are easy to understand.
float Humi;
float Temp;
In order to save the conversion of the numerical values of the measured values into character chains for the display on the screen, two arrays are defined, the characters (char) must contain. An array for every sensor. These arrays must be defined with a length of five characters to save the measured values.
char humidity [5];
char Temperature [5];
Similar steps must be taken for the barometric module BMP180. First, an object is implemented for the sensor. In this case, only one name must be given. It will BMP180 called. A variable must also be defined to save the value and an array to save the conversion of the numerical value into a character chain. In this case, it must have a length of 6 characters.
BMP180 BMP180;
float Pressu;
char Pressure [6];
Only one object remains to implement and define the variables to manage the data of the RTC DS3231 module and display the weekday, the hour and minutes. First of all, an object of the module DS3231 with the name must RTC be implemented. In order to display the days of the week on the screen, a two -dimensional array with signs (char) can be defined that seven lines (one for every weekday) and a length of 12 characters for the name of the day must have.
Rtc_ds3231 rtc;
char DaysoftheWeek [7] [12] = { "Sunday", "Monday", "Tuesday", "Wednesday", "Thursday", "Friday", "Saturday" };
The current hour and the minutes are saved in two variables. Here, too, two arrays (char) are defined that contain the signs of the hour and the minutes that are to be displayed on the TFT screen. These arrays must have a length of 2 characters.
intimately time_h;
intimately time_m;
char time_hours [2];
char time_minutes [2];
After integrating the required libraries, the definition of the variables and the implementation of the module objects, these modules must be initialized and their initial conditions are determined, which in the method set up() happens. First of all, the serial monitor must be initialized in order to display the information about possible errors and messages both when initializing the modules as well as in the execution of the sketch.
Serial.Begin(9600);
Then the TFT screens with the Begin-method Initialized the object of each screen and the yield()-Method is called. This method is used to carry out the next line of the code while the previous lines are executed.
TFT_Pressure.Begin();
tft_clock.Begin();
TFT_T temperature.Begin();
yield();
When creating the voltage to the microcontroller or when resetting the microcontroller, the initial condition must be set. The background color of the display is set and the names and units of measurement are issued. The first screen that needs to be programmed is the one who will display the air humidity and temperature. First of all, the background color of the screen is included TFT_T temperature.Fillscreen(Gc9a01a_black) placed on black and the necessary methods carried out to the text "Humidity %"(Air humidity). The cursor is with TFT_T temperature.setcursor(50, 70) set, the text color on blue with TFT_T temperature.SettextColor(Gc9a01a_blue), the text size to 2 with TFT_T temperature.SettextSize(2) and the text with TFT_T temperature.print("Humidity %") output. Then the method is still yield() executed.
TFT_T temperature.Fillscreen(Gc9a01a_black);
TFT_T temperature.setcursor(50, 70);
TFT_T temperature.SettextColor(Gc9a01a_blue);
TFT_T temperature.SettextSize(2);
TFT_T temperature.print("Humidity %");
yield();
The same happens then "Temperature Celsius"(Temperature),"Pressure HPA" (Pressure), "Date”(Date) and“Time”(Time) in the following lines. You can adapt the colors and the respective position here.
As soon as the initial configuration of each screen is defined, the three modules that deliver the data must be initialized. The first is the DHT22 sensor module. Just call the method Begin() of the object defined for this sensor.
dht.Begin();
The second sensor is the barometer module BMP180 by calling the init()-S method of the BMP180 objects. It is with the serial monitor with Serial.println("BMP180 Init") reported that this module is initialized when the step has been successfully carried out.
BMP180.init();
Serial.print("BMP180 Init");
IF (!BMP180.hasvalidide()) {
Serial.print("Error - Please Check the BMP180 Board!");
}
The last module is the RTC DS3231 watch module. It will be with the method Begin() initialized. The next two lines serve to configure the current date and time. The method rtc.carnival(DateTime(F (__Date__), F (__Time__)) Calls the data that the module has stored in its memory. If you want to adapt the date or time, you need to comment on the previous line and the comment on the line rtc.carnival(DateTime(2024, 9, 3, 0, 0, 33, 0)) remove. There you can manually enter the values for year, month, hour, hour, minute and second manually.
RTC.Begin();
RTC.carnival(DateTime(F (__Date__), F (__Time__)));
// rtc.adjust (DateTime (2024, 9, 1, 0, 33, 0));
This means the definition and analysis of the method set up() completed. The method follows loop()that is continuously carried out. In this method, the temperature and humidity with the methods are first Reading temperature() and readhumidity() of the object created for the DHT module. They are then saved in the defined variables and it is checked whether these two variables contain data. If not, the error is reported via the serial monitor when reading the sensors.
tempo = dht.Reading temperature();
humi = dht.readhumidity();
IF (Isnan(Humi) || Isnan(temp)) {
Serial.print("DHT Sensor Reading Failure !!!!");
}
Then with the method gutpressure() The value of the atmospheric pressure measured by the Barometer BMP180 is determined and in the already defined variable pressu saved.
pressu = BMP180.gutpressure();
The last values to be determined are the date and time values of the DS3231-RTC module for which the snow()-Method of the DS3231 module object is used. To get the current time, the functions are snow.house() and snow.minute() Called and their values in the variables Time_ H and time_m saved by hour and minute.
DateTime snow =RTC.snow();
time_h = snow.house();
time_m = snow.minute();
If all values have been determined and saved, they must be displayed on the corresponding screens. The first values are temperature and humidity on the screen with the designation TFT_T temperature. In order to be able to display the data correctly, the old data on the screen must first be "deleted", i.e. the data is displayed in the background color of the screen and the latest data in the corresponding color. To delete the old data, it is shown again, but with the color, which is configured as the background of the screen. In the case of the screen for temperature and humidity, the background is black, so the values of the coordinates are first configured, the text is configured in black, the size of the text will be 2 and the signs of the array with the text of the converted value are output yield()-Method is also added. With this "deception" the content of the display is deleted.
TFT_T temperature.setcursor(90, 100);
TFT_T temperature.SettextColor(Gc9a01a_black);
TFT_T temperature.SettextSize(2);
TFT_T temperature.print(humidity);
yield();
In order to display the new value on the screen, it is first used by reading the module readhumidity() determined. It is in the variables defined at the beginning of the sketch humi of the type float saved. The numerical value is converted into a string and in the variable convert_humi of the type String with String convert_humi = String(Humi) saved and with convert_humi.tokhar marray(humidity, 5) converted into a sign array. Then the cursor is using the method setcursor() positioned on the coordinates x = 90 and y = 100, the characters to be displayed blue SettextColor() configured, the font size with SettextSize(2) set to 2 and finally the sign of the array to be presented humidity output.
String convert_humi = String(Humi);
convert_humi.tokhar marray(humidity, 5);
TFT_T temperature.setcursor(90, 100);
TFT_T temperature.SettextColor(Gc9a01a_blue);
TFT_T temperature.SettextSize(2);
TFT_T temperature.print(humidity);
yield();
In order to display the values of the temperature, air pressure and the current time, including the weekday, the same steps must be taken. The steps are described in the source code.

outlook
This achieves the goal of the first part of this project and we see the sensor data on the displays. In the end, however, it should look like an old, analog barometer. We take care of this in the second part.


3 comments
Norbert Schrills
Hello Miguel Torres,
I deleted the library and reinstalled it following your instructions.
Now the compilation shows no errors. Thanks for your help.
Regards
Norbert Schrills
Miguel Torres
Hello Norbert Schrills, you have to be careful when installing the BMP180 library, after downloading and unzipping it, you have to remove the “-master” from the folder name, otherwise you will not find the correct library. I have checked the library and inside the BMP180 folder there is a BMP180 file of type CPP, if you open the file there are the lines:
void BMP180::init() {
Wire.begin();
setSamplingMode(BMP180_OVERSAMPLING_STANDARD);
_ID = readID();
readCalibrationData();
}
This is the init method referenced by the line that crashes on you.
Thanks for following us.
Miguel Torres Gordo
Norbert Schrills
Hallo AZ Delivery, sehr schönes Projekt. Habe den Sketch heruntergeladen und alle Bibliotheken installiert. Leider bricht die Kompilierung in Zeile 101 ab mit der Fehlermeldung : Compilation Error : ’ class BMP180 ’ has no member named init. Meine bescheidene Softwarekenntnisse haben den Fehler leider nicht gefunden. Wo kann der Fehler sein ? Ich bitte um Ihre Hilfe. Danke Gruß Norbert Schrills