For a long time I wanted to build a pulse oxymeter to measure the pulse and the oxygen saturation of the blood. It looks pretty simple: Select the microcontroller. Perform four wires. Install libraries and flash sketch. Complete! Complete?
It is not that easy. As expected, the small device runs straight away. The sensor is a small miracle of noisy signal processing and integration density. That makes him interesting, but also a bit sensitive.
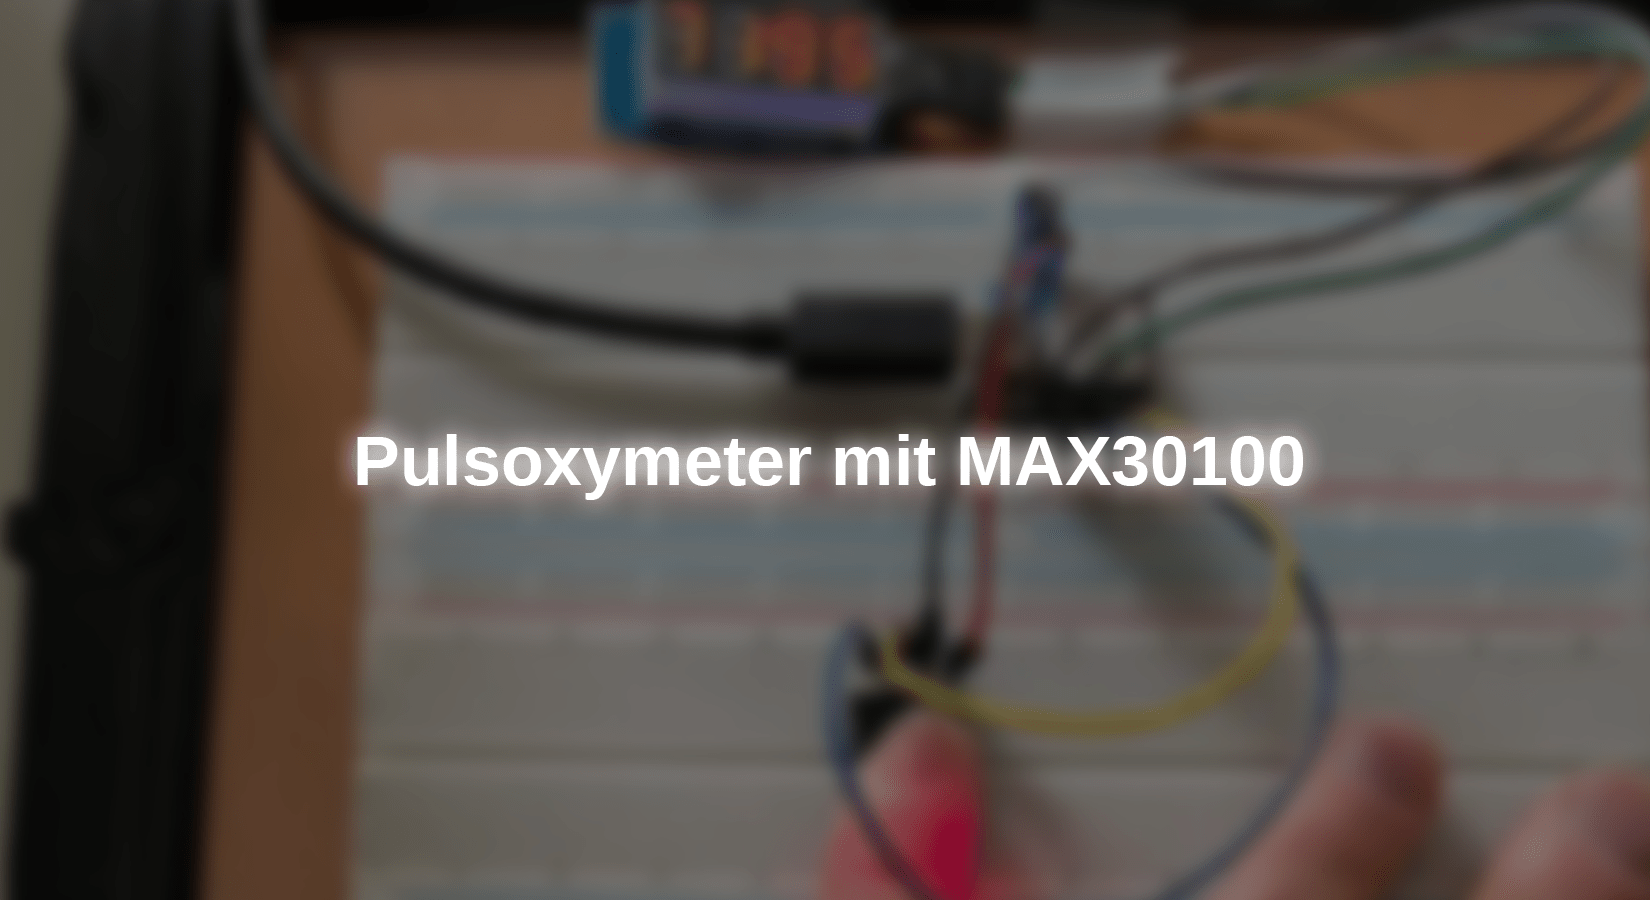
The Breadboard shows the first draft. The first two places on the display show the heart rate. According to the colon, position 3 & 4 show the oxygen saturation in %.
Required hardware

That looks pretty good: the heart rate on the iWatch and the display on the prototype match exactly.
This is not pure coincidence, but comes about through the sketch on the Seeduino Xiao, which forms a gliding average of the measured heart rate values. For this he collects the data for 15 seconds and then delivers a value every second.
However, one should not be surprised about deviations of +/- 10%.
A few rules of conduct must be observed. More on that.
research
Before the start of the work, I researched quite closely. Many instructions can be found online. It seems that they all descend from a few primal libraries that can be found on Github. The Max30100 has been on the market for almost ten years. Today the successors 30102 and 30105 are offered. There are also breakout boards for these sensors.
There are next to the free eBook of AZ-Delivery Many detailed descriptions for how the sensor works, some available to a small dissertation. For this project I followed AZ's eBook.

For functioning only as much: an IR-LED (880 Nm) and a red luminous LED (660 Nm) shed light on your finger, while a special photo look absorbs the reflected light. This signal is evaluated in the Max30100. Signal processing is Tricky-Dicky and needs a little math. If you want to know more, you are happy to deepen the formulas: https://de.wikipedia.org/wiki/Pulsoxymetrie
The Max30100 sends its results to the microcontroller (e.g. AT-, Seeeduino) via the I2C bus. There the respective library (see sketch) converts the raw data and delivers the pulse frequency and the SPO2Value that provides information about the oxygen content of the blood. You can find very similar professional devices at the family doctor.
The practice
In the first tests I immediately got plausible values for the SPO2. However, the displayed values for the pulse frequency not only fluctuated by more than 50 %, some of them were completely wrong. A new research on the web showed that many users are the same. In my later sketch there is a "correction value" (it is the value "42" - supposedly the solution of many problems in the universe). The timing of the sketch is also not uncritical.
After a number of experiments, the most important parameters were clear:
The current that flows through the LEDs can be set via the library. There is a list of permissible settings for this (see Github link). Basically, the less transparency the skin has, the more light is necessary. Please shed light on pachyderms with 50 mA! There is no clear rule on how to find the optimal setting. Since there are professional devices that have to deliver correct values for each patient, I have researched the professionals. Unfortunately without result. This secret could not - yet - be revealed.
During the measurement, the probant should sit and keep his hand loosely and calmly. The finger should only lie lightly on the sensor. Even when you press your finger on the sensor, you get false values. I have set up the housing so that the finger lies as well as possible. But this solution is also not ideal for every person.
In the first attempts, the device was still built on a Breadboard. Even the inevitable ambient light leads to disturbances. The results after installation in the housing (see photos) were better than during the test structure.
I came to satisfactory results after I calculated a sliding mean in sketch. In practical terms, it looks like the sketch hides the heart rate for the first 15 seconds while filling an array with the measured values. Then it continuously shows the measured mean. The spo2He shows immediately.
If the values of another person are to be measured, I recommend the restart of the device. My sketch automatically empties the measurement data array, but not necessarily the cache of the Max30100. So please restart. It has proven itself.

Prototype of the pulsexymeter in a heart -shaped wooden box
Around Getting good results, this process is recommended:
♥︎ Place the finger on when the device switched off, sit quietly, breathe calmly .. oooommmmm ...
♥︎ Just put on the finger lightly, please do not press.
♥︎ Switch on and measure.
♥︎ The heart rate (the pulse) is displayed for the first time after 15s.
The 15s "warm -up time" still have the side effect that the heart rate can stabilize something in the direction of "resting heart rate". If you want to make it even better, you can consciously relax and give yourself a calillance minute before the measurement.
I can open my prototype so that you can see whether the finger lies properly.
Construction of the circuit
The circuit is carried out very simple. The sensor is connected to the SCL, SDA connections of the Seeeduino, i.e. to A4 and A5. Since there are still a lot of free connections, the TM1637 display was connected to D2 and D3. These connections can be freely selected if you make the appropriate selection in the sketch.

When building the prototype in the box, I soldered the few connections. Only the supply lines to the display were designed as a connector.
To flash the microcontroller, the circuit is connected to the PC via USB. Then it can be operated with two 1.5 V AAA batteries. I chose this variant. All you need is an additional on/ off switch that I have realized with a magnet and a shipping switch. When I put the small magnet on the tip of the heart, the device switches on.
This is more of a small gag. A classic tipping switch does the same service.
The sketch
The sketch is based on the Library "Max30_Pulseoximeter.H" by the Github author "Oxullo". After the library is loaded, you upload the sketch. My program is based on the "Max30100_Minimal" example of the same author.
You can watch the device at the start and work via the serial port. If the I2C connection to the sensor does not work, the sketch reports this error.
As soon as the sensor detects the pulse for the first time ("onbeatdetected"), the ongoing measurement begins with a period of one second.
In this sketch, the LED current is set to 7.6 mA. With this value possibly experiment. If no heartbeat is displayed, completely nonsensical values come, or even if the oxygen saturation values appear strange, you can try out the next higher value. Please note the correct syntax: POX.set(Max30100_Led_Curr_7_6ma);
Here is the list of possible settings in this sketch:
- Max30100_LED_CURR_4_4MA
- Max30100_LED_CURR_7_6MA
- Max30100_Led_Curr_11ma
- MAX30100_LED_CURR_14_2MA
- Max30100_LED_CURR_17_4MA
- MAX30100_LED_CURR_20_8MA
- Max30100_LED_CURR_24MA
- Max30100_LED_CURR_27_1MA
- Max30100_LED_CURR_30_6MA
- MAX30100_LED_CURR_33_8MA
- Max30100_LED_CURR_37MA
- Max30100_LED_CURR_40_2MA
- Max30100_LED_CURR_43_6MA
- Max30100_LED_CURR_46_8MA
- Max30100_LED_CURR_50MA
Only these values are permitted, which you can also find in my Github repository as a list of "permissible LED flows". You can choose a value there and transfer it to your sketch via Copy-and-Paste. New compiling high-storey shop finished.
Since our display is limited to four places, the heart rate up to 99 BPM is shown - a resting pulse should not be higher. A rest frequency> 88 BPM is already too much for your doctor. Higher values are displayed correctly, but without the "1" for the 100 position. With a pulse of 110, the device shows a "10" in the two left areas.
The oxygen saturation of the blood can be a maximum of 100%. Since a "00" is displayed on the two right spots even without recognized pulse, the sketch allows itself to be an interference in the measured value (I would never do something like that as a physicist !!) and instead shows a 99% instead of 100%. It was forgiven to me. Of course, 'real' 99% are also displayed correctly.
Here the sketch (Download):
#include <Wire.H>
#include "Max30100_Pulseoximeter.H"
#include <TM1637.H>  // Grove 4-digit display

#define Reporting_period_ms     1000

Pulse oximeter Pox; // instance of the object pulse oximeter

uint32_t tslastreport = 0;
intimately A[15]; // a [0] is not used because the index also serves as a divisor
intimately count = 1;
intimately hrav = 0;
intimately I = 0;
intimately spo2 = 0;
intimately Mr = 0;

const intimately CLK = 2;
const intimately Dio = 3;

TM1637 TM1637(CLK, Dio);

void onbeatdetected() {
  Serial.print("♥︎ ");
}

void arrayclear(){
  for (I=1; I==15; I++){
    A[I]=0;
  }
}

void set up() {

    Serial.Begin(115200);

    Serial.print("Start pulseoxymeters ...");

    IF (!Pox.Begin()) {
        Serial.print("Mistake");
        for(;;);
    } Else {
        Serial.print("Initialization successful");
    }
    Pox.set(Max30100_LED_CURR_27_1MA); // attitude for pachydermen
    Pox.Setonbeatetectedcallback(onbeatdetected);

  TM1637.init();
  TM1637.set(Bright_Typical);

  arrayclear(); // Delete results array
}

void loop() {

    Pox.update(); TM1637.point(Point_on);

    IF (Millis() - tslastreport > Reporting_period_ms) {
      Mr = Pox.thread rate();

      IF (count<15){

        A[count] = Mr;
        hrav = 0;
        for (intimately I=1; I<count+1; I++ ) {
          hrav = hrav+A[I];
        }
        hrav = hrav/count;
        count++;
      }
      Else {
          hrav = 0;

          A[15] = Mr;
          for (intimately I=1; I<16; I++) {
            hrav = hrav+A[I];
          }
          hrav = hrav/45; // conversion factor
          for (intimately I=1; I<15; I++) {
            A[I] = A[I+1];
          }
        }

      Serial.print("Ø Heart Rate:");
      Serial.print(hrav);
      Serial.print("BPM / SPO2:");
      spo2=intimately(Pox.Getspo2());
      Serial.print(spo2);
      Serial.print("%");

      IF (spo2 == 0){
          hrav = 0;
          arrayclear(); count = 1;
          TM1637.Clear display();
      }
      IF (spo2 == 100){
          spo2 = 99;
      }
      IF (count ==15) {
        TM1637.display(0, (hrav / 10) % 10);
        TM1637.display(1, hrav % 10);
      }
      TM1637.display(2, (spo2 / 10) % 10);
      TM1637.display(3, spo2 % 10);

      tslastreport = Millis();
    }

}
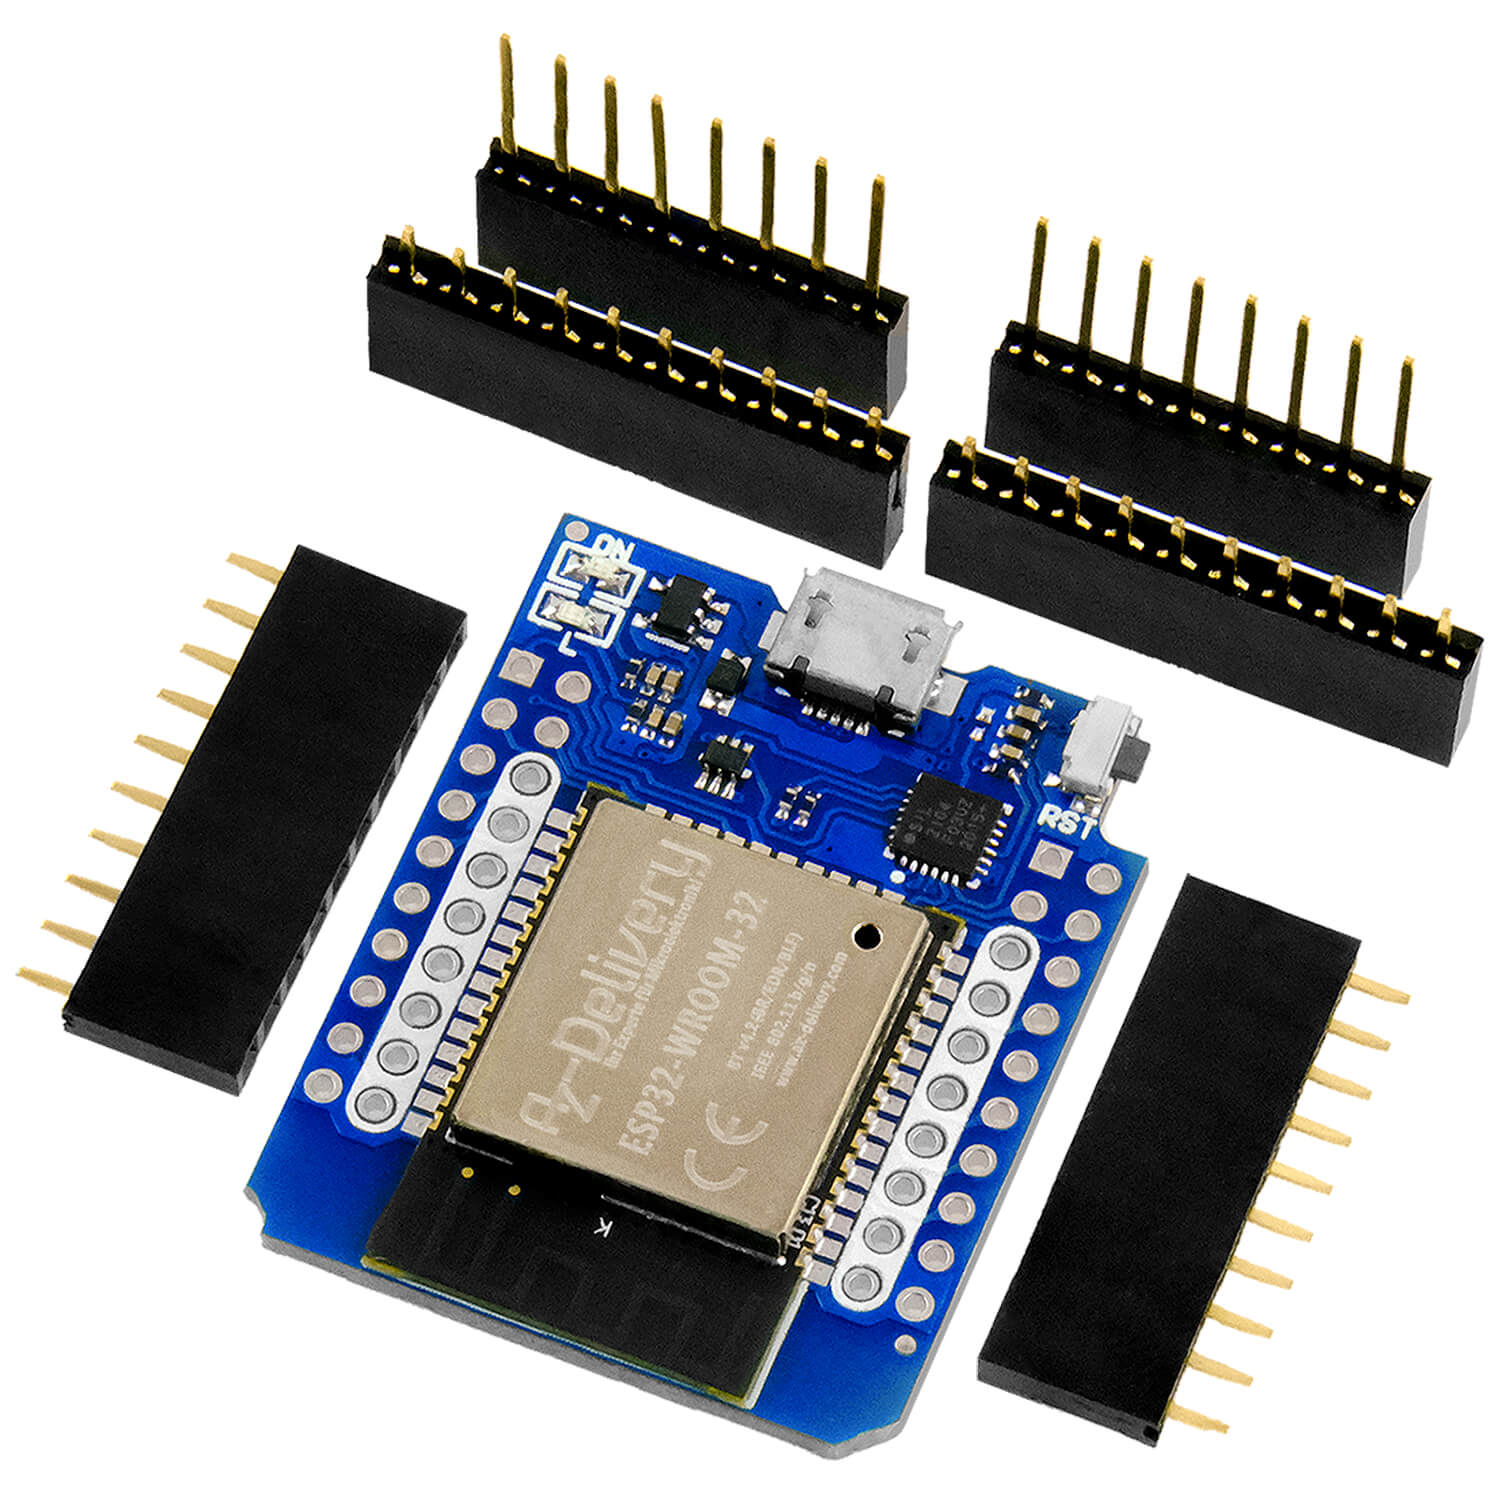
The sketch was with the AT-Mega328p board, the Nano V3 and the Seeeduino tested. The latter was installed because it is particularly compact and has more than sufficient connections.
Known problems
You can ... a Online discussion Tracking - if you enjoy it - that is about whether the Oxullo library is really optimal. There are a few alternatives. However, I didn't find better things.
A peculiarity is the behavior of the device when a measurement has taken place and then the finger is removed again. You may find that the values for pulse and oxygen saturation do not go to zero. Apparently, "Onbeatdetected" does not work perfectly. The result is "phantom values" (we love something ...). It can also be light reflections in the sensor itself, which do not show him that the finger is already gone.
Therefore my recommendation: the measurement cycle explained above works well. Take the time and let your measurement run out in peace.
Measurability
Our DIY device is a nice toy with a reasonable, professional background. But it is not a medical device that your doctor uses. That's why I have my spo2 Let the doctor measure and pleased that the value (multiple) measured there is still a good 2-3% better than the display of the pulsexymeter.
However, I do not dare to testify whether you can generally accept this. Go to the Doc yourself and take your device with you.
One wish to the AZ community-especially on maker with 3D printer:
This project is ideal for a 3D printed housing that is adapted to the compact components. That would be a great project? And maybe someone enjoys designing such a housing, printing and providing the data. Perhaps there is also the opportunity for people without 3D printers to be printed for a couple of €house with colleagues.
Have fun with the device. I look forward to sending your experiences as comments.
Best regards
Michael Klein
https://github.com/michael5411/pulsoxymeter_seeeduino.git
With the .zip download of Github you get all the files at once.
List of documents
- Sketch for direct download
- List of permissible LED currents
- Fritzing presentation of the Breadboard structure
- Readme file


4 comments
Michael Klein
Hallo Joern: Danke für die interessante Anregung. Es würde mich sehr freuen, wenn der Sketch entsprechend erweitert würde.
Hallo Willem: War gerade noch einmal auf meinem Repository. Wenn man dort unter „CODE“ auf „Download ZIP“ geht, bekommt man tatsächlich die ganzen Infos – das ist so gewollt – aber auch „Pulsoxymeter_final.ino“, als den gesuchten Sketch. Und der funktioniert auch, wie ich mich gerade überzeugt habe.
Die Fehlermeldung des IDE 2.3.2 (die ich auch benutze) ist ein Hinweis darauf, dass die installierte Library des TM1637 keine Methode „set“ kennt. Achtung bitte: Es gibt leider nicht nur ein TM1637-Library, sondern leider mehrere. Und wenn man eine andere installiert hat, als die, die in meinem Sketch verwendet wird (Schreibweise bitte genau beachten), dann fällt der Compiler auf die Bretter. Habe sogar schon mal den Fall gehabt, dass ich zwei Libraries mit unterschiedlichen Bezeichnungen hatte und – irgendwie, vielleicht ein Cache? – nahm er immer die falsche Lib. Ich musste erst die falsche Lib deinstallieren, dann töfft es auf einmal.
Viel Erfolg – und JA – für alle Rückfragen bin ich immer gerne zu haben.
Gruß
Michael
Andreas Wolter
@Willem: am Anfang des Sketches finden Sie den Downloadlink zur INO-Datei, der auch funktioniert. Alternativ können Sie auf die Github-Seite wechseln und dort ebenfalls diese Datei herunterladen. Es ist auch möglich, den Quellcode hier von der Webseite zu kopieren.
Grüße,
Andreas Wolter
AZ-Delivery Blog
Joern Becker
Hallo Michael
Vielen Dank für dein Beispielprojekt zum Pulsoximeter, welches mich ermutigt, diese Projekt auch anzugehen.
Vorab würden mich die ungefilterten Pulsdaten für die Dauer 1 Minute interessieren, die du damit misst. Die Varianz der Pulsrate ist die HRV oder Herzratenvariabilität, welche viel über den Stresslevel aussagt: hohe HRV niedriger Stresslevel und umgekehrt. Dieser Wert wird meines Wissens von keinem Produkt unter 400€ (kontinuierlich) gemessen, wobei er aber hohe prognostische Funktion hat (→Wikipedia “HRV”)
Willem
Hallo,
Sehr interessanter Beitrag. Das grosse Problem ist erstens der Downloadlink, statt des sketches bekommt man eine 327kb grosse Datei mit ganz vielen Infos aber keinen sketch.
Beim komplieren des kopierten sketche meldet meine IDE 2.3.2 folgenden Fehler:
Compilation error: ‘class TM1637’ has no member named ‘set’; did you mean ‘setDp’?
setDp funktioniert aber auch nicht.
Schade eigentlich. es liest sich alles sehr gut.
Willem